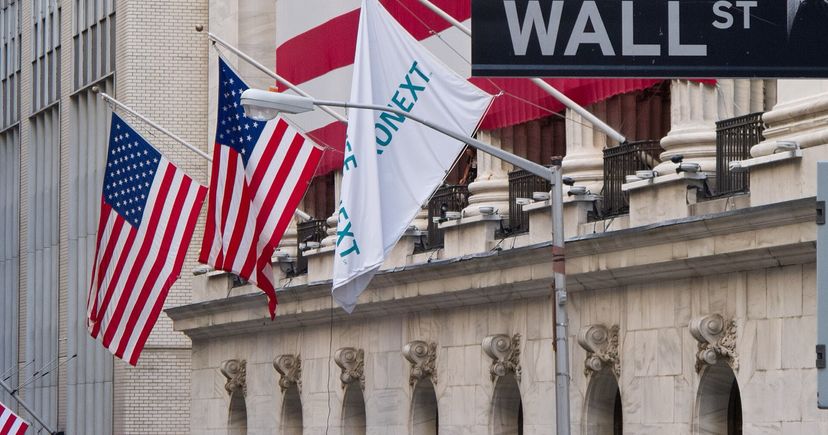
U.S. equities ended the August 17–21, 2026 week lower as technology and rate-sensitive groups retreated. The S&P 500 lost 1.43%, the Nasdaq Composite fell 2.05% and the Dow declined 0.85%. Health care moved the other way with a 4.33% gain, while Treasury yields and the VIX both finished above their August 14 levels.
S&P 500
7,674.37
-1.43% week over week
Nasdaq Composite
26,180.46
-2.05% week over week
Dow Jones
53,277
-0.85% week over week
Cboe VIX
15.13
+6.18% vs. August 14
Health care (XLV)
+4.33%
Technology (XLK)
-3.51%
U.S. 2-year yield
4.24%
+7 bp vs. August 14
U.S. 10-year yield
4.74%
+6 bp vs. August 14
The week in 5 points
- The major indexes finished lower. From the August 14 close to August 21, the S&P 500 fell 1.43%, the Nasdaq Composite 2.05% and the Dow 0.85%.
- Sector leadership changed sharply. Health care gained 4.33%, energy 2.76% and materials 1.87%. Technology lost 3.51%, utilities 3.50% and industrials 3.37%.
- The July FOMC minutes showed a divided hold. Nine members voted to keep the federal-funds target at 3.50%–3.75%, while three preferred a 25-basis-point increase. Many participants said further tightening would likely be needed if inflation did not decline.
- Growth data did not tell one simple story. The Empire State index rose to 20.6 and the Philadelphia Fed index to 47.4, while July industrial production and manufacturing output each grew 0.2%. Housing starts fell 12.4% to a 1.239 million annual rate even as permits rose 5.0% to 1.443 million.
- Volatility rose, but dispersion was much wider. The VIX traded between 14.77 and 16.14 and closed at 15.13. Selected liquid tracked shares ranged from a 47.95% weekly gain to a 24.12% decline.
Sector scoreboard
| Rank | Sector | ETF | Weekly move |
|---|---|---|---|
| 1 | Health care | XLV | +4.33% |
| 2 | Energy | XLE | +2.76% |
| 3 | Materials | XLB | +1.87% |
| 9 | Industrials | XLI | -3.37% |
| 10 | Utilities | XLU | -3.50% |
| 11 | Technology | XLK | -3.51% |
Your tickers this week
| Ticker | August 21 close | Weekly move | Context retained |
|---|---|---|---|
| ASST | $18.22 | +47.95% | Largest selected tracked gain; no single cause assigned |
| BMNR | $22.83 | +26.27% | Second-largest selected tracked gain |
| HIMS | $33.78 | +20.00% | Third-largest selected tracked gain |
| HOOD | $108.13 | +13.15% | Friday’s 13.70% rise amplified the weekly gain |
| AEHR | $101.73 | -24.12% | Largest selected tracked decline |
| NBIS | $219.13 | -21.09% | Large AI-infrastructure decline within the tracked set |
| CRWV | $87.85 | -16.54% | AI-infrastructure shares remained highly dispersed |
| AMKR | $50.26 | -14.80% | Semiconductor weakness extended through the week |
These rows describe closing-price changes, not a complete explanation of why every buyer or seller acted. A weekly price move can reflect several overlapping forces, so the table does not assign one cause to every ticker.
Notable earnings
| Company | Period | Headline result | Important nuance |
|---|---|---|---|
| Ross Stores | Fiscal Q2 2026 | Sales $6.3bn, +13%; comparable sales +10% | EPS $2.66 included about $0.60 of tariff refunds |
| OSI Systems | Fiscal Q4 / FY2026 | Record FY revenue $1.79bn; Q4 non-GAAP EPS $3.78 | Backlog about $1.9bn; delivery timing faced Middle East disruption |
| Flowers Foods | Q2 2026 | Sales $1.193bn, -4.0%; volume -5.8% | Adjusted EPS $0.21; full-year sales and EPS outlooks were reduced |
Wheel seller takeaways
A VIX close of 15.13 was 6.18% above the prior Friday, yet tracked single-stock moves still spanned roughly 72 percentage points. Index volatility therefore does not stand in for an individual option chain. A current educational review still needs the exact expiry and strike, live bid and ask, open interest, event calendar and full cash or share obligation. Option premium is quoted per share; one standard contract normally represents 100 shares.
Next week
- Monday, August 24, and Tuesday, August 25: the current Nasdaq calendars list no earnings from the tracked universe; schedules can change.
- Wednesday, August 26 at 8:30 a.m. ET: BEA schedules the second estimate of second-quarter GDP and corporate profits, plus July personal income and outlays. NVIDIA is listed after the close.
- Thursday, August 27: Marvell Technology is listed after the close. The BLS schedules its 2025–2035 employment projections and 2023–2025 worker-displacement report for 10:00 a.m. ET.
- Friday, August 28 at 10:00 a.m. ET: the BLS schedules first-quarter county employment and wages plus preliminary March 2026 payroll benchmark releases.
The weekly picture combined lower broad indexes, a technology-led retreat, higher Treasury yields, firmer survey data, weaker housing starts and unusually wide single-stock moves. Those layers measure different risks and can change again when next week’s macro releases and large-cap technology earnings arrive. This recap is educational market information, not personalized financial advice or an instruction to trade.
Sources
- [1]S&P 500 daily price history — Cboe Global Markets · Accessed 2026-08-21 · Tier 1
- [2]S&P 500 delayed closing quote — August 21, 2026 — Cboe Global Markets · Accessed 2026-08-21 · Tier 1
- [3]Nasdaq Composite historical prices — August 14–21, 2026 — Nasdaq · Accessed 2026-08-21 · Tier 1
- [4]Nasdaq Composite closing quote — August 21, 2026 — Nasdaq · Accessed 2026-08-21 · Tier 1
- [5]Dow Jones Industrial Average daily price history (DJX) — Cboe Global Markets · Accessed 2026-08-21 · Tier 1
- [6]Dow Jones delayed closing quote (DJX) — August 21, 2026 — Cboe Global Markets · Accessed 2026-08-21 · Tier 1
- [7]Cboe VIX daily price history — Cboe Global Markets · Accessed 2026-08-21 · Tier 1
- [8]Cboe VIX delayed closing quote — August 21, 2026 — Cboe Global Markets · Accessed 2026-08-21 · Tier 1
- [9]Daily Treasury par yield curve rates — 2026 — U.S. Department of the Treasury · Accessed 2026-08-21 · Tier 1
- [10]Health care Select Sector SPDR history — August 14–21, 2026 — Nasdaq · Accessed 2026-08-21 · Tier 1
- [11]Energy Select Sector SPDR history — August 14–21, 2026 — Nasdaq · Accessed 2026-08-21 · Tier 1
- [12]Materials Select Sector SPDR history — August 14–21, 2026 — Nasdaq · Accessed 2026-08-21 · Tier 1
- [13]Industrials Select Sector SPDR history — August 14–21, 2026 — Nasdaq · Accessed 2026-08-21 · Tier 1
- [14]Utilities Select Sector SPDR history — August 14–21, 2026 — Nasdaq · Accessed 2026-08-21 · Tier 1
- [15]Technology Select Sector SPDR history — August 14–21, 2026 — Nasdaq · Accessed 2026-08-21 · Tier 1
- [16]Strive historical prices — August 14–21, 2026 — Nasdaq · Accessed 2026-08-21 · Tier 1
- [17]BitMine historical prices — August 14–21, 2026 — Nasdaq · Accessed 2026-08-21 · Tier 1
- [18]Hims & Hers historical prices — August 14–21, 2026 — Nasdaq · Accessed 2026-08-21 · Tier 1
- [19]Robinhood historical prices — August 14–21, 2026 — Nasdaq · Accessed 2026-08-21 · Tier 1
- [20]Aehr Test Systems historical prices — August 14–21, 2026 — Nasdaq · Accessed 2026-08-21 · Tier 1
- [21]Nebius historical prices — August 14–21, 2026 — Nasdaq · Accessed 2026-08-21 · Tier 1
- [22]CoreWeave historical prices — August 14–21, 2026 — Nasdaq · Accessed 2026-08-21 · Tier 1
- [23]Amkor Technology historical prices — August 14–21, 2026 — Nasdaq · Accessed 2026-08-21 · Tier 1
- [24]August 2026 Empire State Manufacturing Survey — Federal Reserve Bank of New York · Accessed 2026-08-21 · Tier 1
- [25]Industrial Production and Capacity Utilization — July 2026 — Federal Reserve Board · Accessed 2026-08-21 · Tier 1
- [26]Monthly New Residential Construction — July 2026 — U.S. Census Bureau · Accessed 2026-08-21 · Tier 1
- [27]Manufacturing Business Outlook Survey — August 2026 — Federal Reserve Bank of Philadelphia · Accessed 2026-08-21 · Tier 1
- [28]Minutes of the Federal Open Market Committee — July 28–29, 2026 — Federal Reserve Board · Accessed 2026-08-21 · Tier 1
- [29]Ross Stores fiscal Q2 2026 results — SEC Exhibit 99.1 — Ross Stores / SEC EDGAR · Accessed 2026-08-21 · Tier 1
- [30]OSI Systems fiscal Q4 and FY2026 results — SEC Exhibit 99.1 — OSI Systems / SEC EDGAR · Accessed 2026-08-21 · Tier 1
- [31]Flowers Foods Q2 2026 results — SEC Exhibit 99.1 — Flowers Foods / SEC EDGAR · Accessed 2026-08-21 · Tier 1
- [32]BEA news release schedule — U.S. Bureau of Economic Analysis · Accessed 2026-08-21 · Tier 1
- [33]August 2026 release schedule — U.S. Bureau of Labor Statistics · Accessed 2026-08-21 · Tier 1
- [34]Earnings calendar — August 24, 2026 — Nasdaq · Accessed 2026-08-21 · Tier 1
- [35]Earnings calendar — August 25, 2026 — Nasdaq · Accessed 2026-08-21 · Tier 1
- [36]Earnings calendar — August 26, 2026 — Nasdaq · Accessed 2026-08-21 · Tier 1
- [37]Earnings calendar — August 27, 2026 — Nasdaq · Accessed 2026-08-21 · Tier 1
- [38]Earnings calendar — August 28, 2026 — Nasdaq · Accessed 2026-08-21 · Tier 1
- [39]Wall Street photograph and rights record — Wikimedia Commons · Accessed 2026-08-21 · Tier 4
This content is for informational and educational purposes only and is not financial advice. Options involve risk and are not suitable for every investor. Do your own research before trading.
Keep YieldCove close
Choose YieldCove as a preferred source for Top Stories in Google Search.