Key takeaways
- Moderna returned to a quarterly profit as revenue grew 29% and research spending fell.
- The higher cash balance also reflects convertible borrowing—not just operating progress.
- November 12 Analyst Day brings another catalyst; option premiums are not protection against a share-price gap.
MRNA · November 6 regular close
USD 254.19
Last completed session, not live
Close-to-close move
+5.27%
+USD 12.73
Volume / prior 20-session mean
16.30m / 17.26m
0.94×; daily-history series
Cboe IV30 · retrieved Nov 8, 09:35 ET
90.90% annualized
Last-session reference; IV rank unverified
2026 revenue growth outlook
15%–25%
Previously up to 10%
Next earnings date
Unconfirmed
Analyst Day: November 12
A profit returns, with a financing footnote
Moderna finished November 6 at USD 254.19, up USD 12.73 from USD 241.46, a 5.27% regular-session gain. The company reported third-quarter results that morning for the period ended September 30. This Sunday analysis uses the latest completed session, not a live trading offer. Price history · Issuer results
Yahoo’s daily series records 16,296,200 shares, or 0.94 times the preceding 20 sessions’ 17,257,035-share average. A separate Cboe snapshot reports slightly different turnover, so this comparison consistently uses daily history. The price gain did not come with above-average volume on that basis.
One session, three different vaccine-stock moves
MRNA +5.27%, PFE −1.64%, BNTX +1.92%. Price returns, not total returns or forecasts.
Source: Yahoo Finance daily-history series; November 6, 2026 regular close versus November 5. Retrieved November 8 at 09:35 ET; calculations from unrounded source prices.
What changed inside the business
Revenue reached USD 1.313 billion, versus USD 1.016 billion a year earlier; Moderna rounds that growth to 29%. The company attributes the improvement mainly to higher international COVID vaccine sales and deliveries under long-term government partnerships. U.S. revenue was USD 780 million and international revenue USD 533 million. Sales breakdown
| Metric | Q3 2026 | Q3 2025 |
|---|---|---|
| Total revenue | 1,313 | 1,016 |
| Research and development expense | 583 | 801 |
| Cost of sales | 318 | 207 |
| Operating income / (loss) | 130 | (260) |
| Net income / (loss) | 162 | (200) |
| Diluted EPS | 0.38 | (0.51) |
Research and development expense fell 27% to USD 583 million as certain late-stage infectious-disease studies completed or wound down, alongside cost efficiencies. Cost of sales moved the other way, rising to USD 318 million from USD 207 million. The combination produced USD 162 million of net income, a USD 362 million improvement from the prior-year loss.
Management raised expected 2026 revenue growth to 15%–25%, from up to 10%, and cut expected annual R&D expense to about USD 2.7 billion from USD 2.9 billion. Those are forecasts, not booked sales or guaranteed savings. Higher sales and lower research spending help explain the earnings improvement, without proving a single cause for Friday’s stock move. Updated framework
More cash does not mean self-funding
Cash, equivalents and investments were approximately USD 8.0 billion at September 30, versus USD 6.9 billion at June 30. Moderna says the increase primarily reflected USD 2.6 billion of net proceeds from convertible notes and related capped-call transactions. Convertible financing adds financial flexibility, but it is not customer revenue. Cash and financing
The cash-flow warning
For the first nine months, GAAP operating activities used USD 2.715 billion of cash and Moderna recorded a USD 1.963 billion net loss. One profitable quarter does not establish sustained profitability or positive operating cash flow.
The company raised its year-end cash-and-investments forecast to USD 8.1–8.3 billion, from USD 4.7–5.2 billion. The release explicitly credits both operating execution and financing proceeds. Its CFO’s accompanying commentary repeats that distinction, rather than presenting the whole increase as cash earned from the business. CFO commentary
The peer comparison also resists a simple sector-wide explanation: Pfizer fell 1.64% and BioNTech rose 1.92% on November 6. These are different businesses, and one session cannot establish market-share gains. The chart shows relative stock performance, not proof that vaccine demand improved everywhere. Pfizer history · BioNTech history
A profitable quarter is progress. Borrowed cash and operating cash generation still need to be read separately.
What it means for option sellers
Cboe’s delayed file retrieved November 8 at 09:35 ET showed 30-day implied volatility of 90.899%, or 90.90% rounded. This is a last-session reference, not live Sunday pricing; current IV rank was not verified. It therefore cannot establish that premiums are historically expensive. Cboe snapshot
A fall in IV can reduce an option’s value, all else equal, but a share-price drop can overwhelm that benefit for a put seller. The wheel does not remove the risk of owning shares after put assignment. Analyst Day and clinical news can change expectations even after quarterly earnings are behind the stock. Vega · Cash-secured puts
Illustrative mechanics—not a quoted trade
Assume a standard 100-share USD 240 put collects an invented USD 5 premium per share. Gross cash backing is USD 24,000, credit USD 500 and breakeven USD 235 before costs. At a USD 200 expiry price, the loss would be USD 3,500. No expiry, premium or executable contract is being proposed.
A hypothetical USD 275 covered call on 100 already-owned shares illustrates the other side: assignment requires selling those shares at USD 275 and caps further upside. Premium does not insure the shares against a major decline. Real strikes, liquidity and event timing require fresh checks. Covered calls
- Business risk: vaccine sales and delivery timing can fluctuate; lower R&D spending does not guarantee future product success.
- Event risk: clinical results, regulatory decisions and Analyst Day can produce price gaps that option premium may not cover.
- Review plan: rebuild prices and spreads when trading resumes, verify earnings and event dates, and assess the full share obligation rather than premium alone.
What to watch next
- November 10, 2026, 08:30 ET: October U.S. CPI; November 13, 08:30 ET: October PPI, according to the BLS calendar.
- November 12, 2026, 09:00 EST: Moderna Analyst Day, listed on its investor calendar. Watch for updated spending and commercial assumptions, not promised outcomes.
- By year-end 2026: management expects pivotal propionic-acidemia data; no exact readout day is confirmed here. The next earnings date also remains unconfirmed.
The macro backdrop is not irrelevant: the November 6 U.S. employment report showed 165,000 additional payroll jobs in October and 4.1% unemployment. Those figures can influence interest-rate expectations and growth-stock valuations, but they do not explain Moderna’s move by themselves. The next company-specific test is whether stronger sales translate into sustained cash generation. BLS employment · BLS calendar · Investor calendar
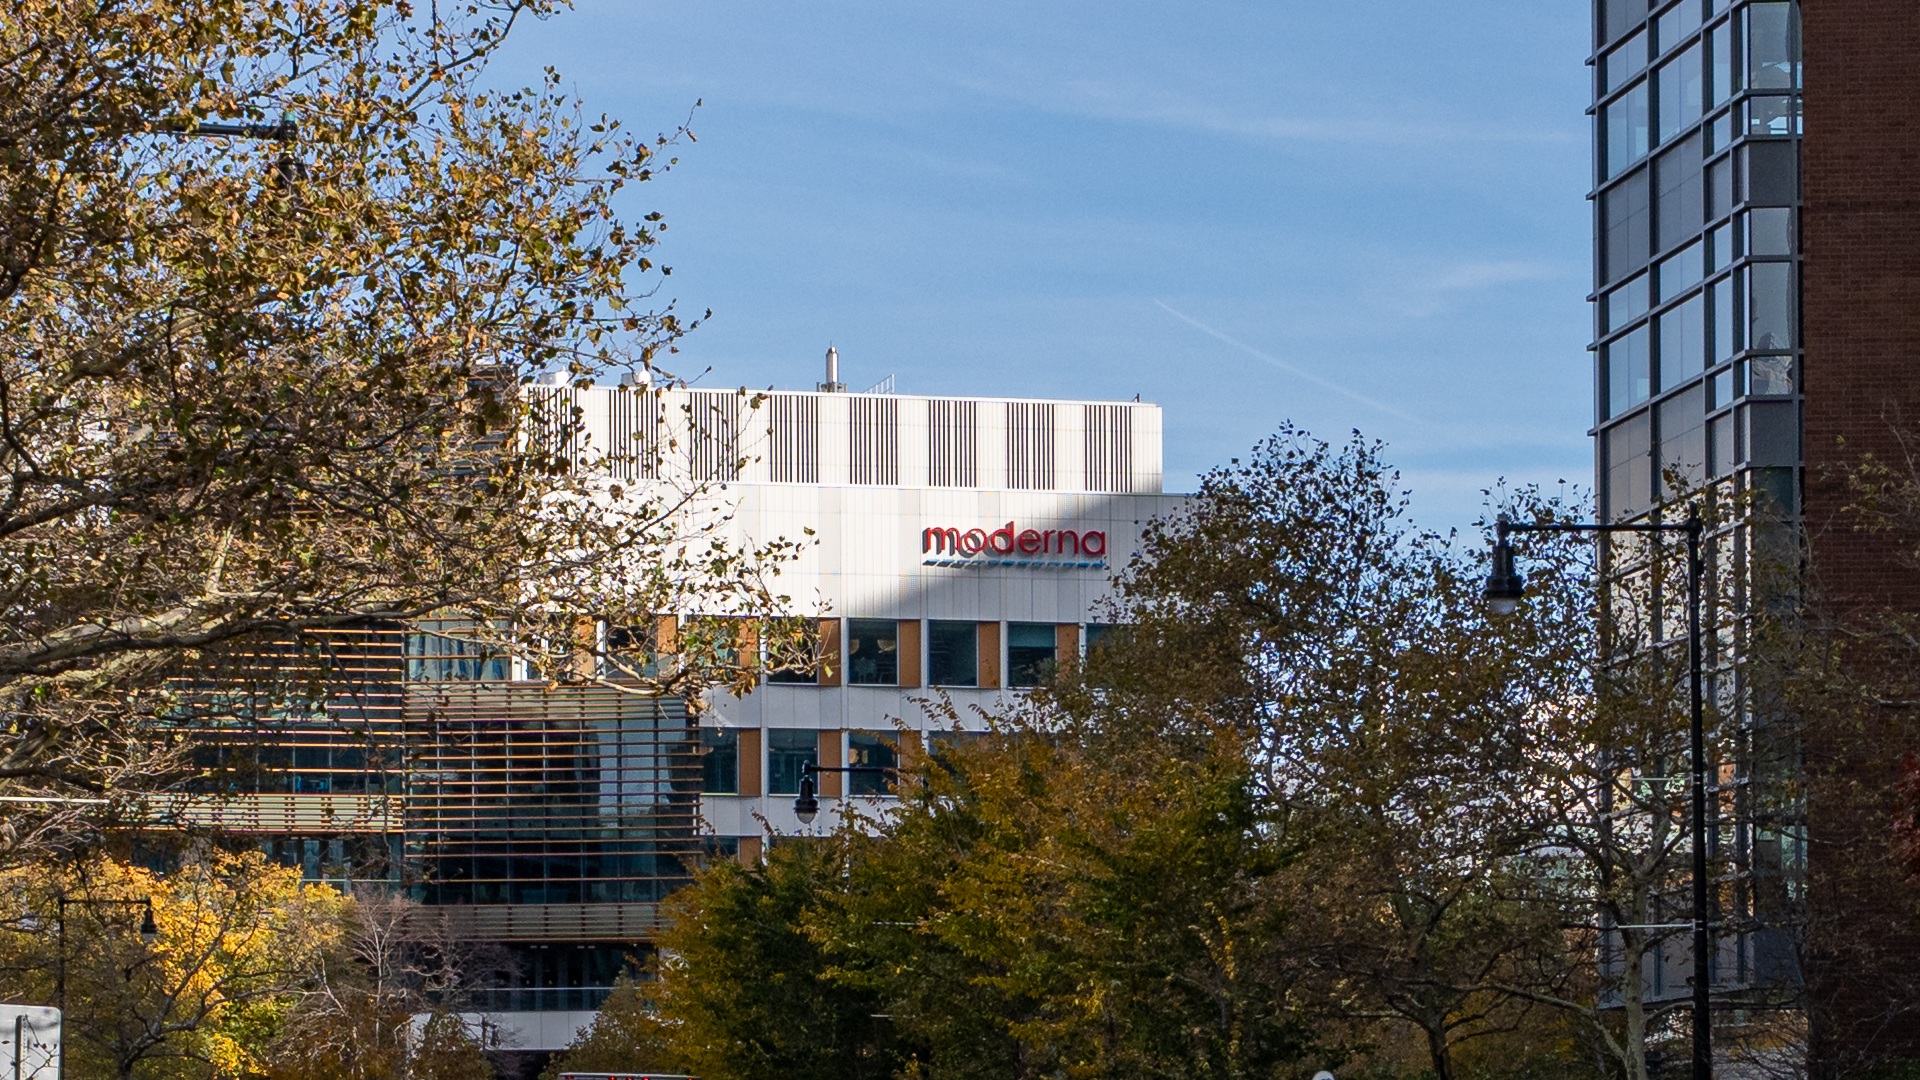
Hero: an archival Moderna office exterior in Cambridge, photographed November 7, 2025—not a scene from these results. Ajay Suresh’s photograph was cropped; source and attribution and CC BY 4.0 licence are available.
Sources
- [1]Moderna Q3 2026 results and financial statements — Moderna / SEC · Accessed 2026-11-08T14:35:37.937761+00:00 · Tier 1
- [2]Moderna CFO Q3 2026 commentary — Moderna · Accessed 2026-11-08T14:35:38.863575+00:00 · Tier 1
- [3]Moderna investor event calendar — Moderna · Accessed 2026-11-08T14:37:46.420003+00:00 · Tier 1
- [4]MRNA daily price and volume history — Yahoo Finance · Accessed 2026-11-08T14:35:38.030433+00:00 · Tier 3
- [5]Pfizer daily price history — Yahoo Finance · Accessed 2026-11-08T14:35:38.132671+00:00 · Tier 3
- [6]BioNTech daily price history — Yahoo Finance · Accessed 2026-11-08T14:35:38.162324+00:00 · Tier 3
- [7]MRNA delayed options and IV30 snapshot — Cboe · Accessed 2026-11-08T14:35:38.253639+00:00 · Tier 1
- [8]October 2026 U.S. Employment Situation — U.S. Bureau of Labor Statistics · Accessed 2026-11-08T14:35:37.832898+00:00 · Tier 1
- [9]November 2026 economic release calendar — U.S. Bureau of Labor Statistics · Accessed 2026-11-08T14:35:37.862917+00:00 · Tier 1
- [10]Cash-secured put mechanics and risks — Options Industry Council / OCC · Accessed 2026-11-08T14:35:37.968584+00:00 · Tier 1
- [11]Covered-call mechanics and risks — Options Industry Council / OCC · Accessed 2026-11-08T14:35:37.983222+00:00 · Tier 1
- [12]Vega and implied volatility — Options Industry Council / OCC · Accessed 2026-11-08T14:35:37.985288+00:00 · Tier 1
- [13]Archival Moderna office photograph and attribution — Ajay Suresh / Wikimedia Commons · Accessed 2026-11-08T14:18:00.341177+00:00 · Tier 1
- [14]Creative Commons Attribution 4.0 International — Creative Commons · Accessed 2026-11-08T14:17:29.557728+00:00 · Tier 1
This content is for informational and educational purposes only and is not financial advice. Options involve risk and are not suitable for every investor. Do your own research before trading.
Keep YieldCove close
Choose YieldCove as a preferred source for Top Stories in Google Search.
Run the numbers before you trade: the free wheel strategy calculator sizes the whole cycle, and the cash-secured put calculator shows the cash, return and breakeven of one put.