Key takeaways
- On’s quarterly sales rose 17.2%, but a CHF 52.6 million tariff refund boosted headline profitability.
- Gross margin was 72.6% reported and 66.9% excluding the refund.
- Shares were down 7.86% at 11:29 ET; lower implied volatility does not remove assignment risk.
ONON, 11:29 ET
USD 34.58
−USD 2.95
Versus November 9 close
−7.86%
Partial-session volume, 11:29 ET
9.69m shares
0.92× full-day 20-session average
30-day IV, delayed Cboe snapshot
45.46%
Retrieved 11:29 ET; IV rank unverified
Next earnings date
Unconfirmed
Q3 released November 10
On Holding’s earnings report delivered growth, but not a clean read on recurring profit. The Swiss sportswear company released third-quarter results on November 10 for the period ended September 30. By 11:29 ET, ONON traded at USD 34.58, down USD 2.95, or 7.86%, from the previous close. On Q3; market snapshot.
Volume had reached 9,691,304 shares, against a calculated 10,512,645-share average over the 20 completed sessions from October 13 through November 9. That is 0.92 times a full day’s average—not an unusually busy full session proved by a morning count. These are timestamped observations, not live prices.
What changed in the earnings report
Net sales increased to CHF 931.4 million from CHF 794.4 million, up 17.2% reported or 17.8% at constant currencies. Net income rose 36.9% to CHF 162.8 million. Diluted Class A earnings were CHF 0.48 per share; adjusted diluted EPS was CHF 0.54. The adjusted figure is non-IFRS, not the same measure as statutory earnings. Financial release.
| Measure | Reported | Excluding refund |
|---|---|---|
| Q3 gross margin | 72.6% | 66.9% |
| Q3 adjusted EBITDA margin | 27.6% | 21.9% |
| 2026 gross-margin outlook | Around 67.5% | Around 66% |
| 2026 adjusted EBITDA margin outlook | 21.0%–21.5% | 19.5%–20.0% |
The CHF 52.6 million U.S. tariff refund matters because it is not another pair of shoes sold. Excluding it, gross margin of 66.9% still exceeded last year’s reported 65.7%. But adjusted EBITDA margin excluding the refund was 21.9%, below the prior reported 22.6%. Operating costs can absorb genuine product-margin gains.
For 2026, On kept its low-20% constant-currency sales-growth outlook, implying CHF 3.47 billion–3.56 billion at current exchange rates. Excluding refunds, gross-margin guidance rose to around 66% from at least 65%; adjusted EBITDA-margin guidance stayed at 19.5%–20.0%. A higher reported outlook is therefore not an across-the-board underlying upgrade.
Why the headline leaves room for doubt
- Direct-to-consumer sales grew 25.0% to CHF 393.3 million, reaching 42.2% of sales. That supports On’s emphasis on full-price selling and its own customer relationships.
- Asia-Pacific sales increased 31.1%, faster than the Americas’ 12.4%. Growth is broad, but geographic momentum is uneven.
- Selling, general and administrative expenses reached CHF 481.0 million from CHF 397.5 million. Expansion still requires spending.
The broader footwear tape was also weaker: Nike fell 3.03% and Deckers 1.71% in nearby 11:29 ET snapshots. ONON’s larger decline is consistent with an additional company-specific reassessment, but price data alone cannot prove how much came from tariffs, guidance or the market. Nike; Deckers.
Footwear shares: intraday change versus November 9 close
November 10, 2026, around 11:29 ET. Separate snapshots, not final session returns.
Source: Yahoo Finance chart snapshots: ONON/NKE 11:29:21 ET; DECK 11:29:01 ET, November 10, 2026. Returns calculated from unrounded prior closes.
The macro backdrop adds consumer-budget risk. Today’s U.S. CPI release showed October prices rising 0.4% month over month and core prices 0.3%, seasonally adjusted. BLS could not publish the headline 12-month change because comparable October 2025 data were missing. Those monthly figures are not annual inflation rates. BLS release.
A refund can improve reported profit without improving the repeatability of that profit.
What it means for option sellers
Cboe’s delayed snapshot retrieved at 11:29 ET showed 30-day implied volatility of 45.46%, down 14.61 percentage points in the feed. Its underlying-stock trade was stamped 10:45 ET, so this is not simultaneous with the share-price panel. IV rank was not verified; 45.46% IV does not mean a 45.46 IV rank. Cboe snapshot.
An earnings release can remove one uncertainty while leaving price risk intact. In the wheel, a cash-secured put can become shares through assignment; a covered call then exchanges some upside for premium. Neither step repairs an overpaid stock purchase. Lower IV can reduce option prices, other things equal, while a falling share price can still hurt a short put. OIC put guide; covered-call guide.
Illustration only—not a quoted trade
For a hypothetical standard 100-share USD 30 put with a purely assumed USD 1.00 credit, cash backing is USD 3,000, premium is USD 100 and expiration breakeven is USD 29. If shares became worthless, loss would be USD 2,900 before fees and taxes. This assumed credit is not an ONON market quote.
A USD 40 covered call is another educational strike example, not a recommendation: it could require selling the covered shares at USD 40 even after a much larger rebound. Actual premiums, spreads, expiry and contract terms need a fresh check before any trade.
The main risk
Today’s earnings are released, but the next earnings date was not confirmed in this research. Do not assume a later expiry avoids results. Assignment can leave the seller owning a stock that keeps falling; a refund is not protection against that loss.
- Assignment risk: falling shares can leave a put seller owning stock with losses much larger than the premium collected.
- Calendar risk: the next earnings date is unconfirmed. An expiry needs a fresh event-calendar review, not an assumption that results are outside it.
- Educational management checklist: refresh prices; review liquidity, the bid/ask spread, expiry and contract terms; reassess stock ownership on assignment and the capped upside if covered shares are called away.
What to watch next
- December 9, 2026: the decision day of the Fed’s December 8–9 meeting. Rate-sensitive valuations and consumer demand remain relevant; no decision is predicted. Fed calendar.
- December 10, 2026, 8:30 ET: November CPI is scheduled. The next inflation release could change the broader backdrop. BLS schedule in release.
- Through year-end 2026: whether holiday growth and full-price selling support On’s stated outlook. Treat that outlook as a forecast, not revenue already earned.
The useful distinction is simple: On is growing, but the reported margin and the margin excluding refunds tell different stories. For option sellers, understanding that difference matters more than treating a lower share price as an automatic bargain.
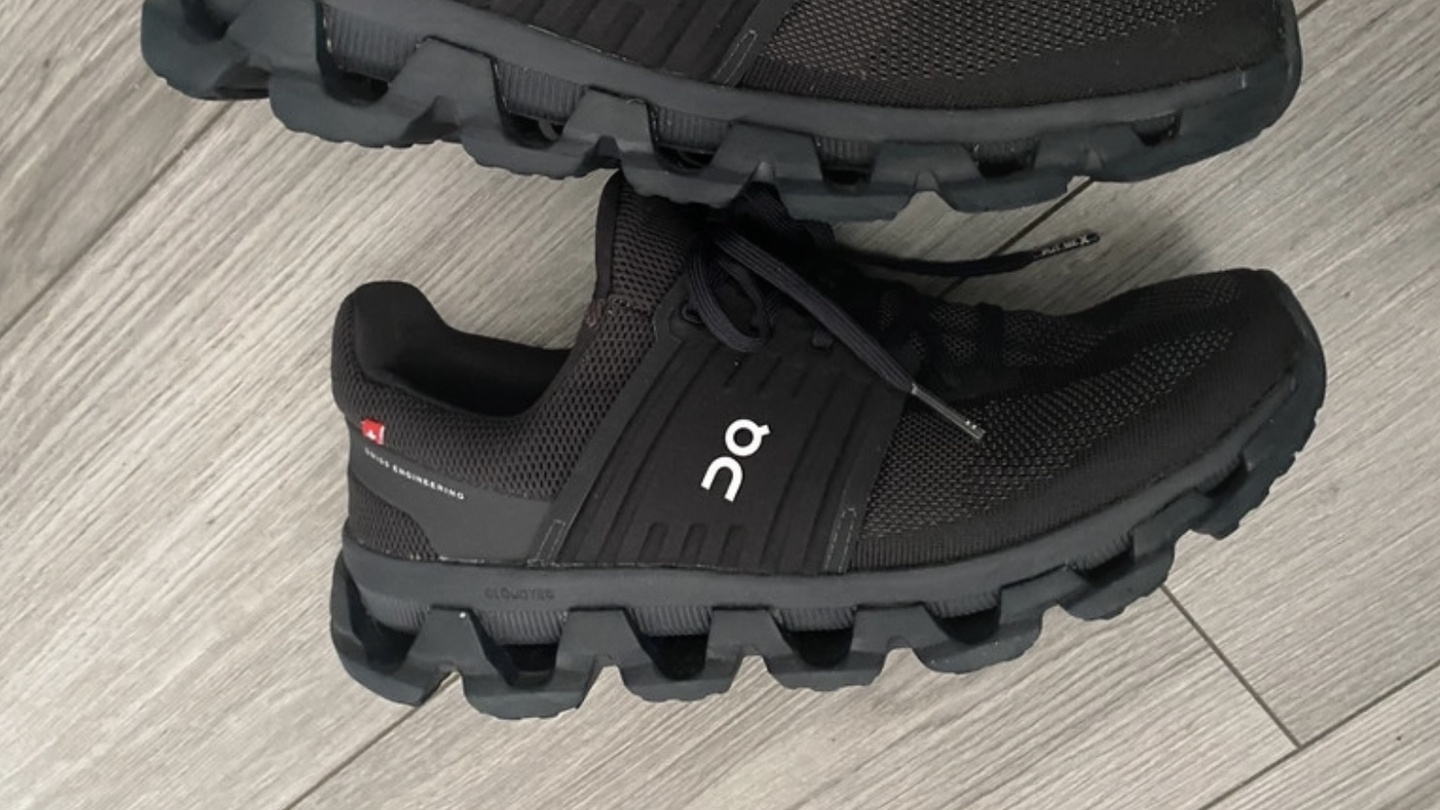
Archival photo: “On Clouds running shoes” by Goodreg3, Wikimedia Commons, CC BY-SA 4.0. Cropped and resized; adaptation under the same license. No endorsement implied.
Sources
- [1]Q3 2026 results and 2026 outlook — On Holding · Accessed 2026-11-10T16:29:22.553178+00:00 · Tier 1
- [2]ONON timestamped stock and historical volume snapshot — Yahoo Finance · Accessed 2026-11-10T16:29:22.824186+00:00 · Tier 3
- [3]Nike timestamped peer-price snapshot — Yahoo Finance · Accessed 2026-11-10T16:29:22.823614+00:00 · Tier 3
- [4]Deckers timestamped peer-price snapshot — Yahoo Finance · Accessed 2026-11-10T16:29:22.997241+00:00 · Tier 3
- [5]ONON delayed options and 30-day implied volatility snapshot — Cboe · Accessed 2026-11-10T16:29:22.703022+00:00 · Tier 1
- [6]October 2026 CPI and next release date — U.S. Bureau of Labor Statistics · Accessed 2026-11-10T16:29:23.255155+00:00 · Tier 1
- [7]2026 FOMC meeting calendar — Federal Reserve · Accessed 2026-11-10T16:29:23.080291+00:00 · Tier 1
- [8]Cash-secured put mechanics and risks — Options Industry Council / OCC · Accessed 2026-11-10T16:29:23.545548+00:00 · Tier 1
- [9]Covered-call mechanics and risks — Options Industry Council / OCC · Accessed 2026-11-10T16:29:23.231419+00:00 · Tier 1
- [10]On Clouds running shoes — archival photograph and licence — Wikimedia Commons / Goodreg3 · Accessed 2026-11-10T16:14:06.499382+00:00 · Tier 1
This content is for informational and educational purposes only and is not financial advice. Options involve risk and are not suitable for every investor. Do your own research before trading.
Keep YieldCove close
Choose YieldCove as a preferred source for Top Stories in Google Search.
Run the numbers before you trade: the free wheel strategy calculator sizes the whole cycle, and the cash-secured put calculator shows the cash, return and breakeven of one put.