BE wheel watch: $200 put leaves a 19.6% cushion
The September 18 $200 put showed an $11.68 reference credit and a 19.6% breakeven cushion at 11:53 a.m. ET. Bloom’s growth and AI-power story meet below-norm IV and a valuation far above fuel-cell peers.
YieldCove Desk
4 min read

BE spot at 11:53 a.m. ET
$234.21 · −0.85%
RSI(14), through Aug. 13
53.05 · neutral
Put IV vs 3-month norm
95.39% vs 127.58%–128.64%
Time to expiry
35 DTE
Reference credit
$11.68 per share
Annualized comparison
60.9%
The setup in 30 seconds
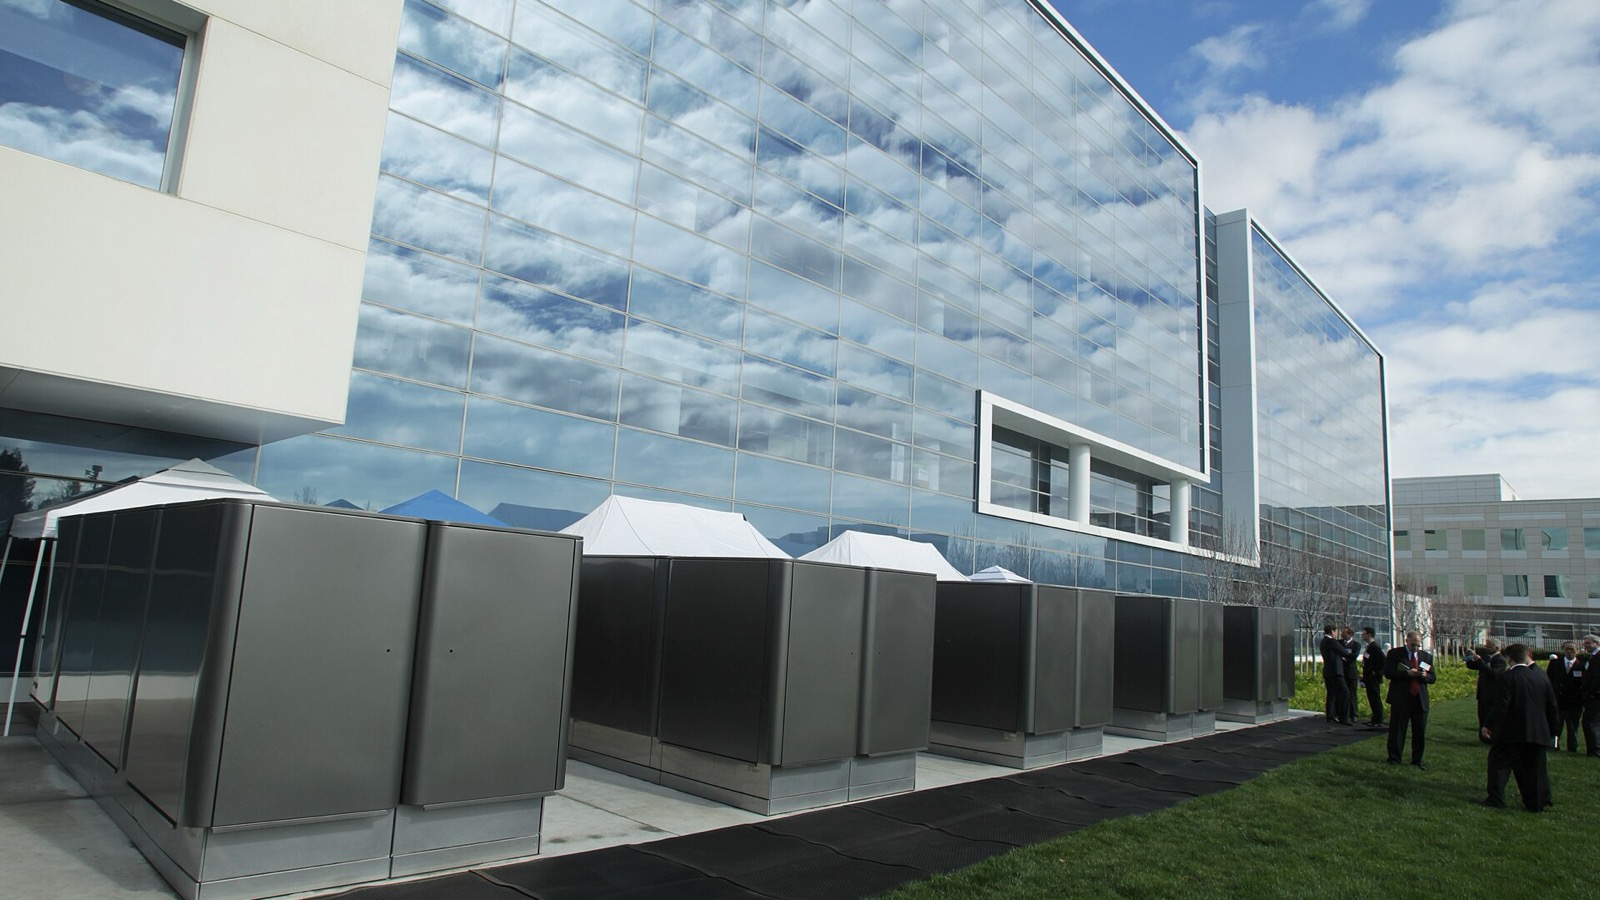
Bloom Energy builds onsite solid-oxide fuel-cell systems for data centers and other power-hungry customers. At 11:53 a.m. ET on August 14, BE was $234.21 on Nasdaq; Cboe showed $234.42 nearby, while Barchart showed $233.00 at 11:51. This educational ticket studies the September 18 $200 cash-secured put, with 35 days to expiry (DTE) and delta near 0.243. An $11.68 reference credit lowers breakeven to $188.32, or 19.6% below the reference spot. BE edged NBIS and CRWV in the finalist scorecard because its contract paired solid two-feed liquidity with the highest weighted mix of collateral return and technical posture. The warning is just as clear: contract IV is far below BE’s own three-month norm, and the $200 strike sits well above the nearest observed low. The midday live-entry window ends at 12:30 p.m. ET; rebuild delayed quotes in a broker.
New to cash-secured puts?
Selling one put creates an obligation to buy 100 shares at the strike if assigned. “Cash-secured” means reserving the full $20,000 strike collateral without margin. The credit reduces the effective share cost, but it cannot protect against a sharp valuation reset or customer delay.
The trade
| Field | Reference |
|---|---|
| Ticker / strategy | BE cash-secured put |
| Contract | September 18, 2026 $200 put |
| DTE / delta | 35 DTE / ~0.243 |
| Entry limit | $11.40–$11.90 per share ($1,140–$1,190 per contract); no market orders |
| Reference credit | $11.68 per share / $1,168 per contract |
| Liquidity | 4,891 open interest · 1,165 volume on both feeds |
| Cash reserved | $20,000 |
| Breakeven | $188.32 · 19.6% below $234.21 spot |
| Max return | 5.84% in 35 days · ~60.9% annualized comparison |
| Maximum loss | $18,832 if BE fell to $0, before fees |
Cboe displayed $11.35 bid / $12.00 ask, while Nasdaq displayed $11.35 / $11.90. Both feeds listed 4,891 contracts of open interest and 1,165 contracts traded. Their displayed spreads were about 4.7%–5.6% of midpoint, inside the 8% cap. Cboe measured delta −0.2434 and 95.39% IV. The $11.68 reference sits inside both markets; it is comparison math, not a promised fill.
Why this stock, why now
Technicals. Through August 13, RSI(14) was 53.05, a neutral reading. The 20-day, 50-day and 200-day averages were $210.73, $248.39 and $183.96; the $234.21 snapshot sat above the 20-day and 200-day lines but below the 50-day line. Volume at 11:53 a.m. was 5.13 million shares, or 0.29× the prior 20-session full-day average. The nearest observed low under the strike was $157.33. In plain terms: momentum has steadied, but the strike is not protected by nearby support.
Valuation and growth. Two public screens placed Bloom at 48.41×–66.84× forward earnings and 22.10×–22.35× sales. Plug Power and FuelCell Energy were still loss-making, so forward P/E was not useful; their price-to-sales ranges were 4.38×–4.39× and 9.69×–10.58×. Bloom’s filed second-quarter revenue was $1.0654 billion, up 165.5% from $401.2 million a year earlier. In plain terms: growth is real, but the stock already carries a much richer sales multiple than those fuel-cell peers.
Income and calendar
The put’s 95.39% IV was below Barchart’s 127.58% three-month reading and AlphaQuery’s 128.64% 63-observation mean. The $11.68 credit equals 5.84% of collateral for 35 days, or 60.9% annualized as comparison math—not a forecast. Bloom last reported on July 28 after the close; no next date was announced on the checked earnings pages, so no report is confirmed inside the contract. July U.S. retail sales was scheduled for August 14 at 8:30 a.m. ET, before this snapshot. Nasdaq lists no BE ex-dividend date.
News and catalyst check. The prior 72 hours brought no new operating 8-K or 10-Q; the current SEC items were an ownership amendment and a Form 144. Headlines continued to revisit the AI-data-center power theme, while the primary company context remained Nebius’s May 20 announcement of its Bloom partnership. No new analyst action cleared the two-source bar. In plain terms: the business story is still about delivering existing AI-power commitments, not a newly filed contract today.
The exit plan
- Take profit: buy back around $5.84 after retaining about 50% of the $11.68 reference credit.
- Time exit: if unresolved, close or roll around 14–21 DTE, roughly August 28 to September 4.
- Roll trigger: if BE closes below the $183.90 200-day area with more than 21 DTE, reassess and consider only an out-and-down roll that still produces a credit.
- Assignment path: assignment means owning 100 shares at the $188.32 effective cost. Covered calls may continue the wheel, but they cannot erase a stock loss.
What would invalidate this
The setup stops fitting the screen if BE closes below the $183.90 200-day area with more than 21 DTE, if the $200-put spread widens above 8%, or if a new filing weakens the customer-demand or funding case. A support break calls for a fresh ownership review rather than an automatic roll.
What could go wrong
- Valuation reset: a 48.41×–66.84× forward-P/E range can contract quickly if AI-power enthusiasm cools.
- Customer or project timing: delayed installations can make uneven fuel-cell revenue and cash collection more painful.
- Contract and stock risk: a slide toward $183.90 can put the $188.32 breakeven under pressure; the $18,832 maximum loss dwarfs the $1,168 credit.
Beginner corner
DTE means days to expiry. Delta measures option-price sensitivity, not a guaranteed assignment probability. IV is implied volatility. Breakeven is strike minus credit. Assignment means buying 100 shares per contract at the strike. Open interest counts outstanding contracts; volume counts contracts traded today.
Sources
- [1]NYSE 2026 trading hours and holidays — New York Stock Exchange · Accessed 2026-08-14 · Tier 1
- [2]U.S. market status on August 14, 2026 — Nasdaq · Accessed 2026-08-14 · Tier 1
- [3]BE current quote and market status — Nasdaq · Accessed 2026-08-14 · Tier 1
- [4]BE September listed option chain — Nasdaq · Accessed 2026-08-14 · Tier 1
- [5]BE delayed option quotes and Greeks — Cboe Global Markets · Accessed 2026-08-14 · Tier 1
- [6]BE one-year price and volume history — Nasdaq · Accessed 2026-08-14 · Tier 1
- [7]BE quote and three-month option volatility — Barchart · Accessed 2026-08-14 · Tier 3
- [8]BE 30-day implied-volatility history — AlphaQuery · Accessed 2026-08-14 · Tier 3
- [9]Bloom Energy valuation statistics — StockAnalysis · Accessed 2026-08-14 · Tier 3
- [10]Plug Power valuation statistics — StockAnalysis · Accessed 2026-08-14 · Tier 3
- [11]FuelCell Energy valuation statistics — StockAnalysis · Accessed 2026-08-14 · Tier 3
- [12]Bloom Energy valuation and technical snapshot — Finviz · Accessed 2026-08-14 · Tier 3
- [13]Plug Power valuation snapshot — Finviz · Accessed 2026-08-14 · Tier 3
- [14]FuelCell Energy valuation snapshot — Finviz · Accessed 2026-08-14 · Tier 3
- [15]Bloom Energy Q2 2026 Form 10-Q — SEC EDGAR · Accessed 2026-08-14 · Tier 1
- [16]Bloom Energy Q2 2026 financial results — Bloom Energy via SEC EDGAR · Accessed 2026-08-14 · Tier 1
- [17]BE earnings-date page — Nasdaq / Zacks · Accessed 2026-08-14 · Tier 2
- [18]BE dividend history — Nasdaq · Accessed 2026-08-14 · Tier 1
- [19]Bloom Energy recent SEC submissions — SEC EDGAR · Accessed 2026-08-14 · Tier 1
- [20]Nebius and Bloom Energy partner on AI infrastructure power — Nebius Group · Accessed 2026-08-14 · Tier 1
- [21]BE current news and market snapshot — Finviz · Accessed 2026-08-14 · Tier 3
- [22]Economic indicators calendar — U.S. Census Bureau · Accessed 2026-08-14 · Tier 1
- [23]This-week economic calendar — Fair Economy · Accessed 2026-08-14 · Tier 3
- [24]Bloom Energy Servers at eBay photograph — Wikimedia Commons · Accessed 2026-08-14 · Tier 4
This content is for informational and educational purposes only and is not financial advice. Options involve risk and are not suitable for every investor. Do your own research before trading.
More tips from the desk

Wheel screen says wait: 1 line, 0 complete spot checks
One PLTR put cleared the mechanical option gates, but it lacked the complete independent spot confirmation required for entry math. No premium or expected fill is published from the 9:52 a.m. ET snapshot.

Wheel screen says wait: 2 lines, 0 complete spot checks
Two TSLA puts cleared the mechanical option gates, but neither had the complete independent spot confirmation required for entry math. No premium or expected fill is published from the 9:53 a.m. ET snapshot.

CRDO wheel watch: $200 put, 19.4% cushion, earnings inside
CRDO near $234.04 shows a Sep 18 $200 cash-secured put around $11.25 mid (5.62% in 30 days; ~68% annualized as comparison math) and breakeven $188.75 (~19.4% below spot). Sep 1 after-close earnings fall inside the window, so delta stays near the bottom of the house band on delayed public data.