Key takeaways
- Fiscal Q1 revenue rose 12.4% to USD253.153 million; adjusted earnings reached USD0.52 per share.
- Bookings reached USD370.5 million, supporting a higher fiscal-2027 outlook.
- Free cash flow was negative USD24.379 million despite a GAAP profit.
- Premarket prices and volatility references below are snapshots, not live trading terms.
MRCY close, Nov 10
USD83.58
+4.97%, before results
Nov 10 share volume
1,380,600
1.98× prior 20-session mean
Nov 11 premarket, 06:21 EST
USD85.85
+2.72% vs Nov 10 close
30-day IV reference
79.96%
Pre-open file; IV rank unverified
Next earnings date
Unconfirmed
Following Nov 10 release
FY2027 adjusted EBITDA outlook
Around USD210 million
Management expectation
What happened
Mercury Systems reported fiscal first-quarter 2027 results on November 10 for the quarter ended October 2, 2026. The aerospace-and-defense electronics supplier posted USD253.153 million of revenue, up 12.4% year over year, and USD13.088 million of GAAP net income, reversing a USD12.515 million loss. Adjusted earnings doubled to USD0.52 per share; GAAP diluted earnings were USD0.21. Results (1)
The shares closed November 10 at USD83.58, up USD3.96, or 4.97%, from November 9. That regular-session rise came before the results release, so it is not an earnings reaction. Daily-bar volume was 1,380,600 shares, versus a 698,810-share mean for the preceding 20 sessions: 1.98 times normal on that defined basis. Market data (3)
A separate Yahoo premarket snapshot showed USD85.85 at 06:21 EST on November 11, USD2.27 or 2.72% above the regular close. It was retrieved at 06:29 EST and is not a live or executable quote. Premarket indications do not establish where the next regular session will open. Premarket snapshot (6)
| Metric | FY2027 Q1 | FY2026 Q1 |
|---|---|---|
| Revenue | 253.153 | 225.209 |
| GAAP net income / loss | 13.088 | −12.515 |
| GAAP diluted EPS, USD | 0.21 | −0.21 |
| Adjusted EPS, USD | 0.52 | 0.26 |
| Adjusted EBITDA | 56.395 | 35.568 |
| Free cash flow | −24.379 | −4.366 |
Why the outlook improved
Bookings reached USD370.5 million, with a 1.46 book-to-bill ratio: orders exceeded revenue. Backlog was USD2.0614 billion, including USD1.0429 billion expected to become revenue within 12 months. Backlog improves visibility, but it is neither current sales nor cash already collected. Presentation (2)
- Drivers cited by management: stronger weapons-system, radar and electronic-warfare bookings.
- Execution: programs moving into higher-volume production and a more favorable product mix.
- Margins: gross margin reached 35.2%, versus 27.9% a year earlier.
Mercury now expects fiscal-2027 revenue approaching USD1.1 billion and adjusted EBITDA around USD210 million, versus its earlier view of approaching USD200 million. Expected free-cash-flow conversion relative to adjusted EBITDA rises from approaching 35% to approaching 40%; that is a management forecast, not achieved cash generation. The outlook depends on delivering the orders. Guidance (2)
The broader defense comparison was also positive before Mercury reported: RTX (4) rose 2.02% and L3Harris (5) gained 1.67% on November 10. Those returns provide sector context, not proof that the same driver moved all three shares. Mercury’s larger move should not be confused with a sector-wide earnings conclusion.
Defense-stock comparison: November 10, 2026
Regular-session close-to-close moves; Mercury released results afterward.
Source: Yahoo Finance daily bars (3–5); Nov 10, 2026 USD closes vs Nov 9; captured Nov 11 at 06:29 EST.
The cash-flow catch
Adjusted EBITDA is not cash in the bank. Operating activities used USD13.966 million, and USD10.413 million of capital spending took free cash flow to negative USD24.379 million. Inventory and other working-capital demands help explain why a profitable quarter can still consume cash. Cash-flow reconciliation (1)
More orders improve visibility; turning those orders into cash is the next test.
What it means for option sellers
Cboe’s file retrieved at 06:29 EST on November 11 displayed 30-day implied volatility of 79.96%. Treat it as a pre-open reference, not a verified post-earnings options quote; IV rank was unavailable in the retrieved data. Earnings-related option premiums can shrink after a report, but volatility need not fall if new risks appear. Delayed snapshot (7) Options pricing (16)
For the wheel, a lower put strike changes the possible purchase price, not the business risk. A USD75 put and a USD90 covered call illustrate different obligations, not recommendations; neither comes with a claimed current premium or probability of profit. A covered call can require selling the shares at USD90 while retaining substantial downside exposure. Put mechanics (14) Covered calls (15)
Educational math, not a quote
Assume a standard 100-share USD75 put sold for a hypothetical USD1.50 per share. Gross collateral is USD7,500, credit USD150 and expiry breakeven USD73.50 before fees. If the stock became worthless, the loss would still be USD7,350; a small premium is not a safety net.
The main risk
Orders can convert slowly, costs can rise and defense funding can change. A post-earnings volatility drop does not cancel a major share-price fall, and a sold put still carries assignment risk.
- Risk check: government-funding delays, production execution and inventory requirements remain relevant.
- Liquidity check: current bid/ask spreads and open interest matter more than yesterday’s theoretical premium.
- Review plan: reassess cash conversion and the latest guidance before treating assignment as routine.
- Management framework: account for fees and the ability to own assigned shares; check live prices before any trade.
What to watch next
Inflation remains part of the backdrop: October CPI rose 0.4% month over month, seasonally adjusted, after 0.6% in September; core CPI rose 0.3%. Those November 10 figures matter for the rate environment, but do not prove the cause of Mercury’s share move. BLS release (8)
- November 11: the first regular session after the results tests the premarket indication.
- November 13, 08:30 EST: October producer-price data are scheduled. BLS calendar (9)
- Next Mercury earnings: no confirmed date established from the sources reviewed; do not assume an expiry avoids that event.
About the photograph
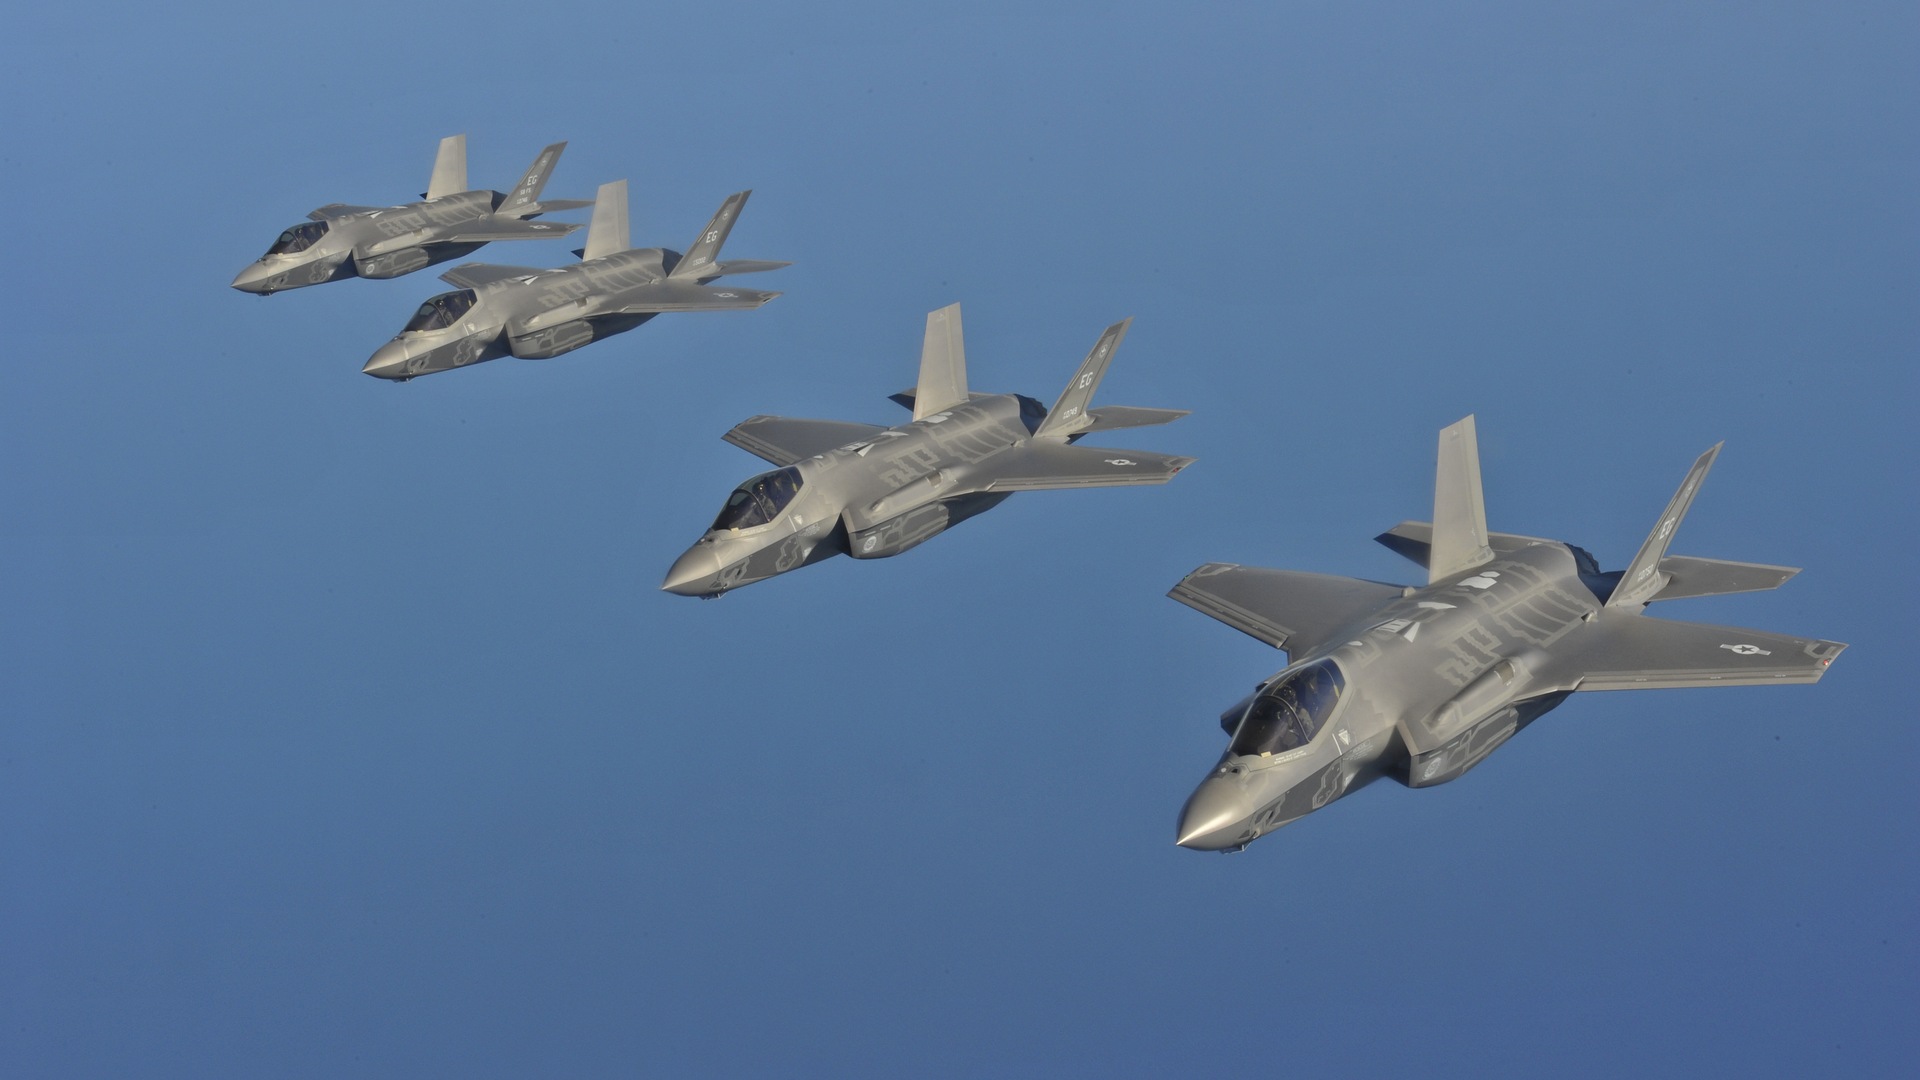
Archival 2013 U.S. Air Force photograph by Master Sgt. Donald R. Allen, via DVIDS (10) and Wikimedia Commons (11); public-domain military work (13), cropped and resized. It illustrates aviation-industry context, not Mercury hardware or this earnings event.
The appearance of U.S. Department of War (DoW) visual information does not imply or constitute DoW endorsement. This is editorial context only. Usage terms (12)
Sources
- [1]Mercury Systems fiscal Q1 2027 results and reconciliations — Mercury Systems / SEC EDGAR · Accessed 2026-11-11T11:31:00.101170+00:00 · Tier 1
- [2]Mercury Systems fiscal Q1 2027 presentation, November 10, 2026 — Mercury Systems / SEC EDGAR · Accessed 2026-11-11T11:29:26.099807+00:00 · Tier 1
- [3]MRCY daily market data: November 10 close and volume — Yahoo Finance · Accessed 2026-11-11T11:29:26.078167+00:00 · Tier 2
- [4]RTX daily market data: November 10 close — Yahoo Finance · Accessed 2026-11-11T11:29:26.079417+00:00 · Tier 2
- [5]L3Harris daily market data: November 10 close — Yahoo Finance · Accessed 2026-11-11T11:29:26.377371+00:00 · Tier 2
- [6]MRCY November 11 premarket snapshot — Yahoo Finance · Accessed 2026-11-11T11:29:56.897497+00:00 · Tier 2
- [7]MRCY delayed quote snapshot retrieved before the options open — Cboe · Accessed 2026-11-11T11:29:26.251000+00:00 · Tier 1
- [8]Consumer Price Index, October 2026, released November 10 — U.S. Bureau of Labor Statistics · Accessed 2026-11-11T11:29:26.420048+00:00 · Tier 1
- [9]November 2026 economic-release calendar — U.S. Bureau of Labor Statistics · Accessed 2026-11-11T11:29:26.138690+00:00 · Tier 1
- [10]Archival F-35A photograph and creator credit — DVIDS / U.S. Air Force · Accessed 2026-11-11T11:18:53.607963+00:00 · Tier 1
- [11]F-35A flight: source image and public-domain declaration — Wikimedia Commons · Accessed 2026-11-11T11:18:53.500133+00:00 · Tier 4
- [12]DVIDS copyright and nonendorsement terms — DVIDS · Accessed 2026-11-11T11:18:53.605193+00:00 · Tier 1
- [13]Public-domain U.S. military official-duty works — Wikimedia Commons · Accessed 2026-11-11T11:18:53.615286+00:00 · Tier 4
- [14]Cash-secured put: assignment, breakeven and maximum loss — Options Industry Council / OCC · Accessed 2026-11-11T11:36:39.725453+00:00 · Tier 1
- [15]Covered call: assignment and downside exposure — Options Industry Council / OCC · Accessed 2026-11-11T11:37:14.609652+00:00 · Tier 1
- [16]Option-price behavior around earnings and implied volatility — Options Industry Council / OCC · Accessed 2026-11-11T11:36:39.774881+00:00 · Tier 1
This content is for informational and educational purposes only and is not financial advice. Options involve risk and are not suitable for every investor. Do your own research before trading.
Keep YieldCove close
Choose YieldCove as a preferred source for Top Stories in Google Search.
Run the numbers before you trade: the free wheel strategy calculator sizes the whole cycle, and the cash-secured put calculator shows the cash, return and breakeven of one put.