Key takeaways
- Nebius rebounded 11.26% in a November 11 premarket snapshot, ahead of its own earnings.
- Results are due November 12 before the open; the call starts at 08:00 EST.
- Fast revenue growth comes with heavy infrastructure spending and financing obligations.
- A large option premium would not remove the risk of an earnings gap.
NBIS, Nov 11, 09:27 EST
USD149.08
+11.26% vs Nov 10 close; snapshot
Nov 10 regular close
USD134.00
−5.27% vs Nov 9
Nov 10 daily-bar volume
20,274,800 shares
0.79× preceding 20-session mean
Pre-open 30-day IV reference
117.94%
Not a post-open quote; rank unverified
Next earnings
Nov 12, before open
08:00 EST conference call
What happened
Nebius shares rebounded before their next major test. A Yahoo Finance observation at 09:27 EST on November 11 showed USD149.0832, or USD149.08 rounded: up USD15.08 and 11.26% from Tuesday’s USD134.00 regular close. This is a dated premarket snapshot, not a live price or a confirmed opening level. Snapshot (7)
Tuesday had been rougher: NBIS fell USD7.45, or 5.27%, from November 9. Its daily bar recorded 20,274,800 shares, against a 25,536,885-share mean for the preceding 20 sessions—0.79 times that baseline. The volume comparison describes the completed session, not Wednesday’s premarket turnover. Market data (6)
Nebius has not reported Q3 results yet in the sources reviewed. Its October 30 announcement schedules publication for Thursday, November 12, before the market opens, followed by an 08:00 EST conference call. A rebound today is therefore not evidence of an earnings beat tomorrow. Official schedule (1)
Why the rebound matters
CoreWeave’s November 10 report supplies an important sector comparison. The AI-cloud peer posted USD3.661 billion of quarterly revenue and raised its full-year revenue outlook to USD13.0–13.3 billion. That offers a stronger demand signal for the sector, but CoreWeave’s sales are not Nebius’s sales, and the report does not establish why every NBIS trade occurred. Peer results (5)
The prior session: November 10, 2026
Close-to-close returns, before Wednesday’s rebound; not synchronized premarket quotes.
Source: Yahoo Finance daily bars (6, 8, 9), Nov 10 vs Nov 9, 2026; USD prices; retrieved Nov 11 at 09:27 EST.
Nebius’s last reported quarter shows both the opportunity and the cost. Q2 revenue rose 454% year over year to USD582.3 million; the company attributed growth to added capacity, higher pricing and improved utilization. Its AI-cloud annualized revenue run rate reached USD3.0 billion, calculated as the final month’s revenue multiplied by 12—not revenue already earned over a year. Q2 letter (3)
| Metric | Q2 2026 |
|---|---|
| Group revenue | 582.3 |
| Year-over-year revenue growth | 454% |
| Group adjusted EBITDA, non-GAAP | 236.2 |
| GAAP loss, continuing operations | −190.4 |
| Operating cash flow, continuing operations | 2,246.1 |
| Property, equipment and intangible purchases | 5,657.4 |
| AI-cloud annualized run rate, USD billions | 3.0 |
Financing buys time, not certainty
The USD3.5 billion Citi senior secured facility was announced on October 22, not today. It has a 364-day maturity and initially costs Term SOFR plus 2.75 percentage points annually, with that spread increasing to as much as 3.50 points, subject to other adjustments. Proceeds support data-center development, GPU purchases and general corporate purposes. Facility terms (4)
That financing flexibility matters because infrastructure is expensive before it earns revenue. Q2 operating cash flow from continuing operations was positive USD2.2461 billion, while property, equipment and intangible purchases were USD5.6574 billion. Positive adjusted EBITDA therefore should not be read as proof that expansion pays for itself. Cash-flow statement (2)
Financing buys time; delivered capacity and recognized revenue must still follow.
What it means for option sellers
Cboe’s file retrieved at 09:27 EST on November 11 showed 30-day implied volatility of 117.94%. It is a pre-open reference, not a verified post-open options quote; IV rank was not established. An expiry crossing November 12 carries the earnings event, and high implied volatility is not a forecast of direction. Volatility reference (10)
For the wheel, an illustrative USD120 cash-secured put means potentially buying shares at USD120 through assignment. An illustrative USD160 covered call means potentially delivering shares at USD160, while keeping substantial downside exposure. These are educational strike examples, not quoted contracts, attractive-entry claims or recommendations. Put obligations (13) Covered-call obligations (14)
Educational math, not a market quote
Assume one standard 100-share USD120 put sold for a hypothetical USD3 per share. Gross reserved cash is USD12,000, credit USD300 and expiry breakeven USD117 before fees. If the shares became worthless, the loss would be USD11,700. This arithmetic does not establish an available premium or a probability of profit.
The main risk
A disappointing report or capacity delay could gap the shares below a put strike before a seller can react. A volatility drop after results would not necessarily offset that share-price loss.
- Risk review: construction, power access, financing costs and customer concentration deserve attention.
- Liquidity review: check current spreads and open interest rather than assuming a theoretical premium is tradable.
- Management framework: allow for fees and possible put assignment; a roll is another transaction, not a guaranteed repair.
- Before any trade: check live prices and reassess the thesis after the actual earnings release.
What to watch next
The macro backdrop remains uncomfortable for capital-intensive growth companies. October CPI rose 0.4% month over month, seasonally adjusted, after 0.6% in September; core CPI rose 0.3%. Those November 10 data provide rate-risk context, not proof of the cause of today’s NBIS move. BLS release (11)
- November 12, before open: Nebius Q3 results; 08:00 EST call. Watch revenue conversion, spending and funding details. Schedule (1)
- November 13, 08:30 EST: October producer-price data, another inflation checkpoint. BLS calendar (12)
About the photograph
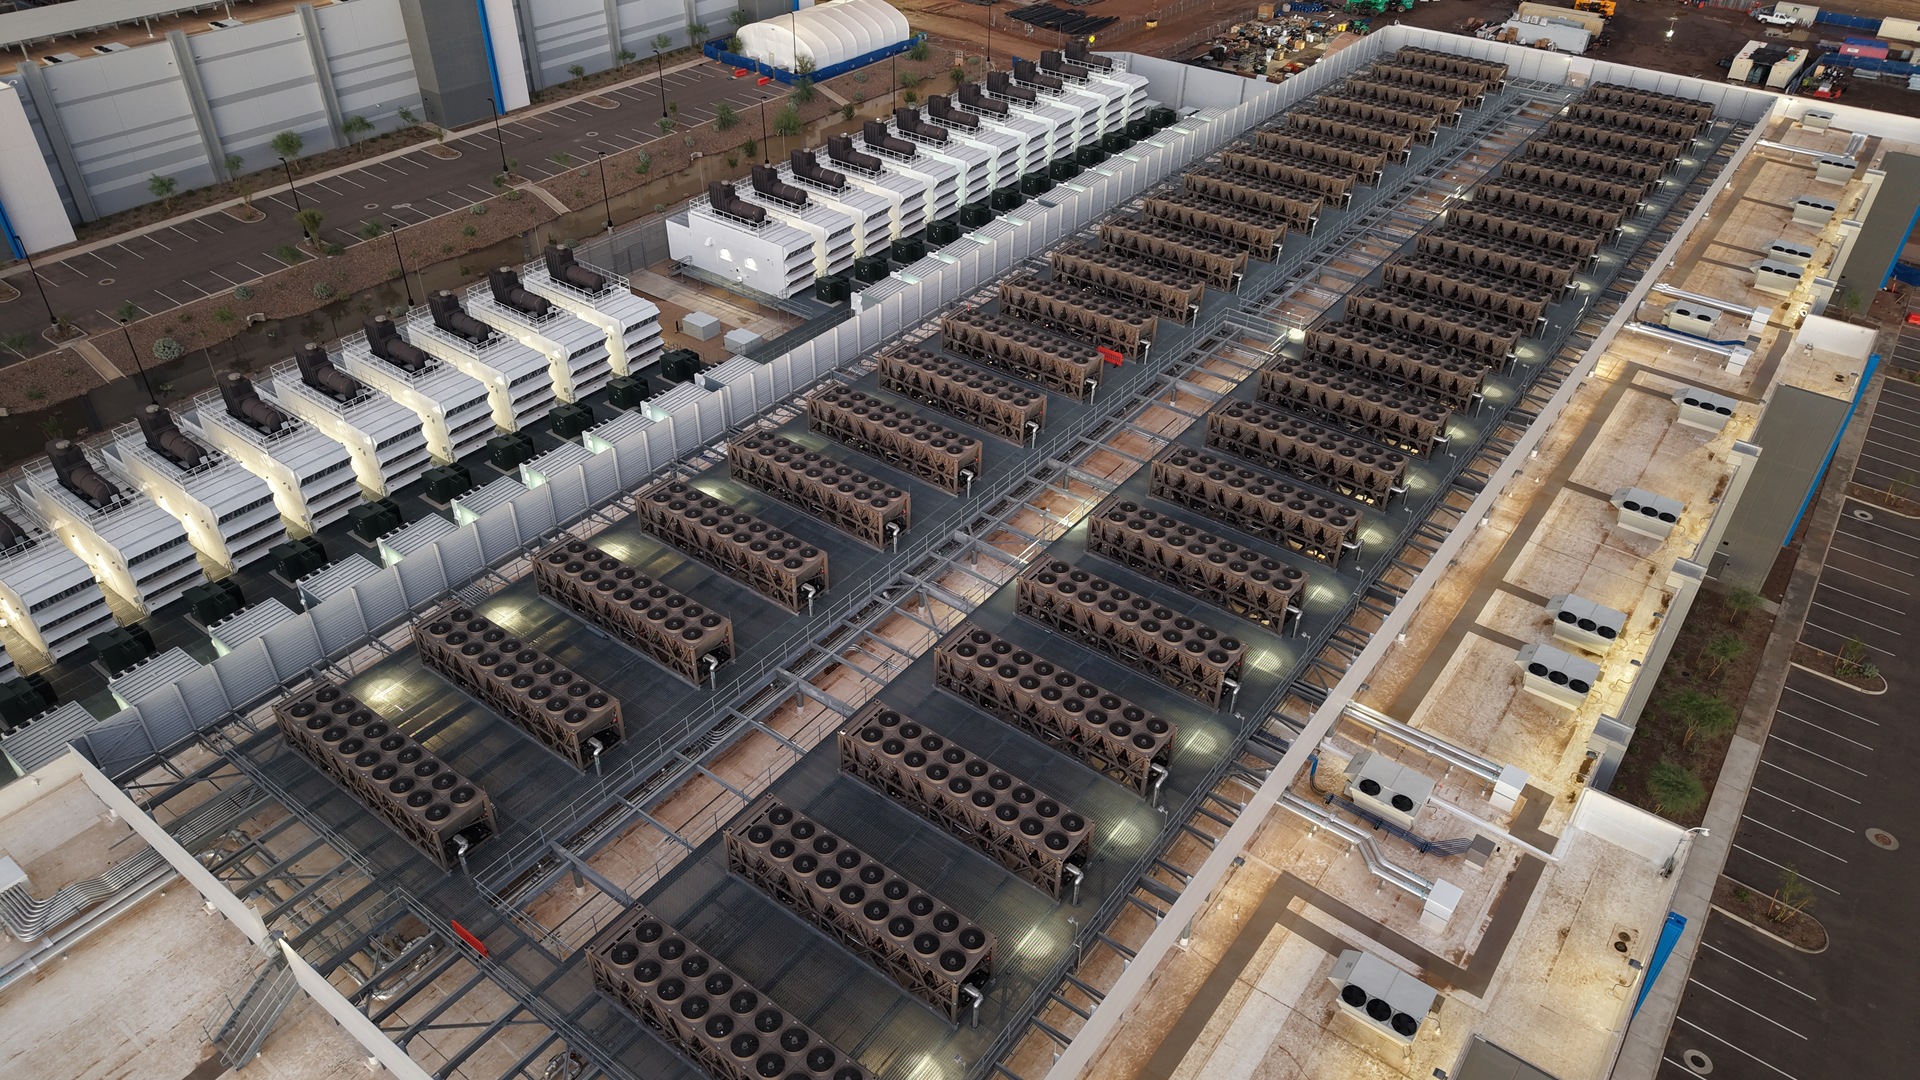
Archival photograph by Rsparks3 / Wikimedia Commons (15), dedicated under CC0 1.0 (16). Cropped, resized and re-encoded, with metadata removed. It shows general data-center cooling infrastructure, not a Nebius facility or this earnings event.
Sources
- [1]Nebius Q3 2026 results date and 08:00 ET call — Nebius · Accessed 2026-11-11T14:27:18.846593+00:00 · Tier 1
- [2]Nebius Q2 2026 financial results, August 12 — Nebius · Accessed 2026-11-11T14:27:18.110618+00:00 · Tier 1
- [3]Nebius Q2 2026 shareholder letter, August 12 — Nebius · Accessed 2026-11-11T14:27:18.177253+00:00 · Tier 1
- [4]Nebius USD3.5 billion Citi facility, October 22 — Nebius · Accessed 2026-11-11T14:27:18.531303+00:00 · Tier 1
- [5]CoreWeave Q3 2026 results and outlook, November 10 — CoreWeave · Accessed 2026-11-11T14:27:18.048566+00:00 · Tier 1
- [6]NBIS November 10 regular close and daily-bar volume — Yahoo Finance · Accessed 2026-11-11T14:27:19.691192+00:00 · Tier 2
- [7]NBIS November 11 premarket observation at 09:27 EST — Yahoo Finance · Accessed 2026-11-11T14:27:20.301211+00:00 · Tier 2
- [8]CRWV November 10 close-to-close return — Yahoo Finance · Accessed 2026-11-11T14:27:19.717064+00:00 · Tier 2
- [9]IREN November 10 close-to-close return — Yahoo Finance · Accessed 2026-11-11T14:27:20.049793+00:00 · Tier 2
- [10]NBIS delayed-quote file, retrieved before the options open — Cboe · Accessed 2026-11-11T14:27:18.270844+00:00 · Tier 1
- [11]October 2026 CPI, released November 10 — U.S. Bureau of Labor Statistics · Accessed 2026-11-11T14:27:19.803805+00:00 · Tier 1
- [12]November 2026 economic-release calendar — U.S. Bureau of Labor Statistics · Accessed 2026-11-11T14:27:19.671521+00:00 · Tier 1
- [13]Cash-secured put: obligations and risk — Options Industry Council · Accessed 2026-11-11T14:27:19.777629+00:00 · Tier 1
- [14]Covered call: obligations and risk — Options Industry Council · Accessed 2026-11-11T14:27:19.840580+00:00 · Tier 1
- [15]Data center roof: creator, image and CC0 dedication — Wikimedia Commons · Accessed 2026-11-11T14:17:21.864564+00:00 · Tier 4
- [16]CC0 1.0 Universal Public Domain Dedication — Creative Commons · Accessed 2026-11-11T14:18:09.082405+00:00 · Tier 4
This content is for informational and educational purposes only and is not financial advice. Options involve risk and are not suitable for every investor. Do your own research before trading.
Keep YieldCove close
Choose YieldCove as a preferred source for Top Stories in Google Search.
Run the numbers before you trade: the free wheel strategy calculator sizes the whole cycle, and the cash-secured put calculator shows the cash, return and breakeven of one put.