
Market close: stocks slip as Meta rallies and yields climb
The S&P 500 fell 0.48% as the VIX rose to 16.46 and the 10-year Treasury yield reached 4.83%. $META gained 6.55%, contrasting with a modest decline in $AAPL.
YieldCove Desk
2 min read
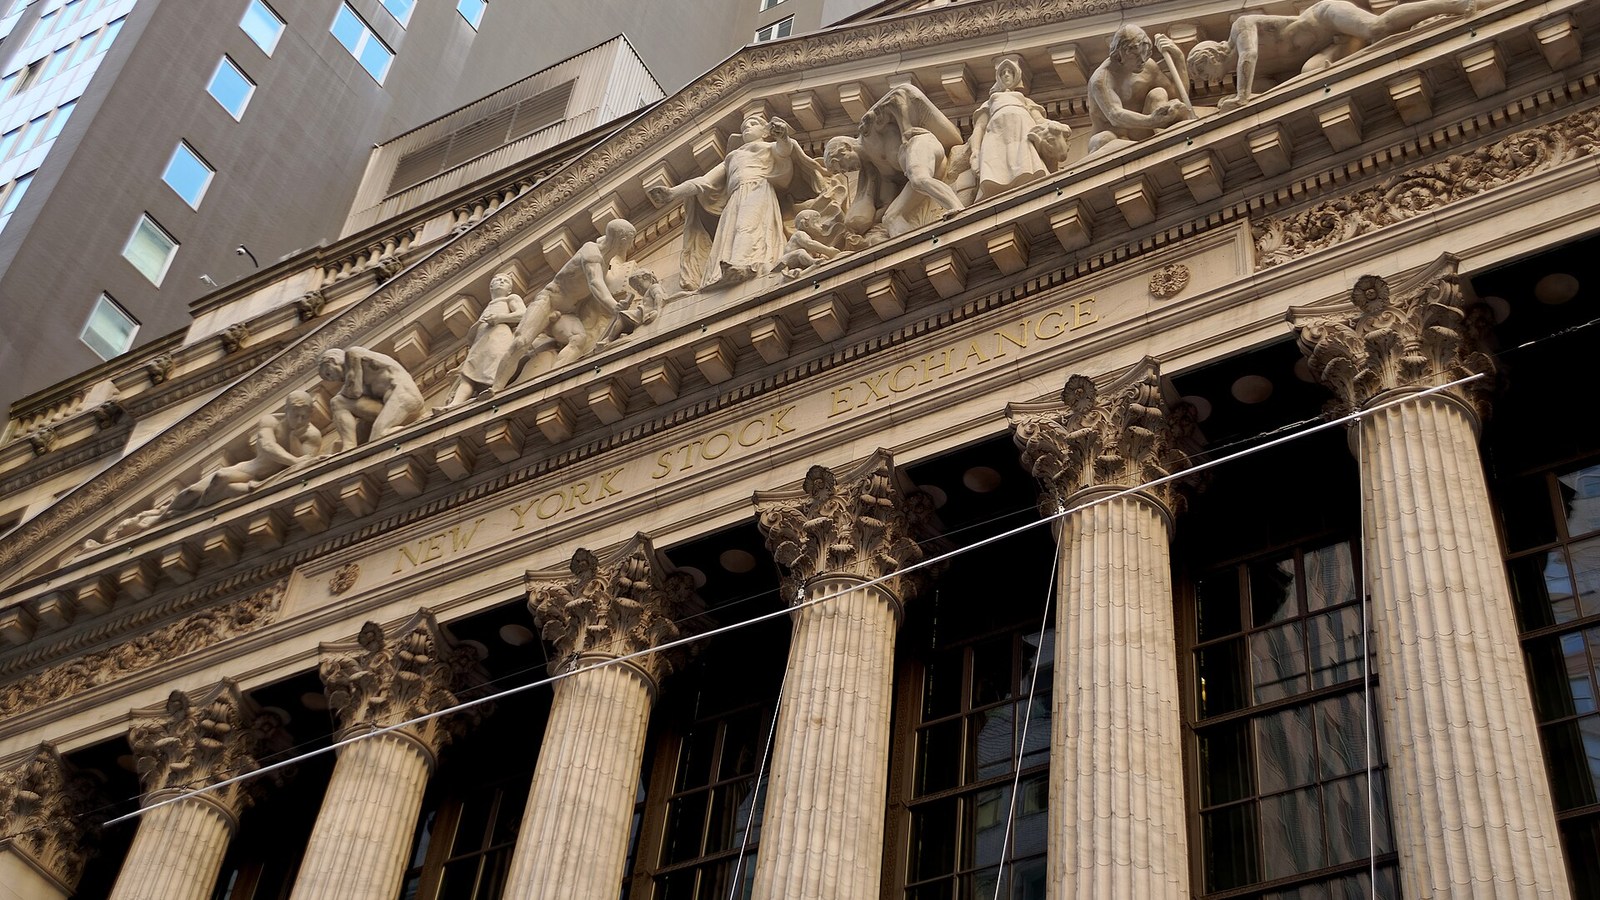
US equity benchmarks slipped on 2026-09-09, but the session was far from uniform. The S&P 500 fell 0.48% and the Nasdaq-100 lost 0.29%, while $META gained 6.55%. Volatility rose and the Treasury yield curve moved higher, leaving wheel investors with a familiar distinction: collecting income is not the same as reducing the underlying stock risk. [1–3,5,6]
S&P 500
7636.36
-0.48%
Nasdaq-100
29421.55
-0.29%
VIX
16.46
+4.71%
10-year Treasury
4.83%
+3 bps
The session: weaker benchmarks, selective strength
The figures below are Cboe end-of-session readings for 2026-09-09, compared with the prior session on 2026-09-08; they are not after-hours trading quotes. Index levels are in points and share prices in US dollars. The Nasdaq-100 is a different benchmark from the broader Nasdaq Composite. [1–5]
| Instrument | Previous session | Latest session | Change |
|---|---|---|---|
| S&P 500 | 7673.52 | 7636.36 | -0.48% |
| Nasdaq-100 | 29507.70 | 29421.55 | -0.29% |
| $AAPL | 316.22 | 315.34 | -0.28% |
| $META | 613.48 | 653.69 | +6.55% |
A lower market did not mean every stock fell
Session percentage changes, 2026-09-09 versus 2026-09-08. These are stock and index moves, not option returns.
Source: Cboe, 2026-09-09. [1,2,4,5]
Interpretation: the index cannot stand in for the stock
$AAPL moved modestly lower while $META rose sharply. That contrast matters for a wheel portfolio: positions with the same broad technology exposure can deliver very different assignment and upside outcomes. A large daily gain is not, by itself, evidence of cheap valuation or attractive option pricing. [4,5]
Volatility and rates both moved higher
The VIX rose from 15.72 to 16.46, an increase of 0.74 points, or 4.71%. It reflects the options market’s expectation of S&P 500 volatility, not the implied volatility of a particular $AAPL or $META contract. It also measures expected variability, not a forecast of market direction. [3,7]
| Maturity | Previous yield | Latest yield | Change |
|---|---|---|---|
| 2 years | 4.39% | 4.43% | +4 bps |
| 10 years | 4.80% | 4.83% | +3 bps |
| 30 years | 5.25% | 5.28% | +3 bps |
The 10-year par yield reached 4.83%, up 3 basis points, while the 2-year reached 4.43%, up 4 basis points. These are Treasury par-yield observations, not executable bond quotes or the rate paid on brokerage cash. Higher yields accompanied the equity decline; the comparison alone does not establish what caused the sell-off. [6]
Two wheel lessons from $AAPL and $META
- $AAPL: the 315.34 USD session reading was 0.28% below the previous close. A smaller decline than the index does not establish a margin of safety. For a cash-secured put, the central exposure is still the obligation to buy the shares at the strike if assigned—not merely the premium collected. [1,4,8]
- $META: the 653.69 USD session reading was 6.55% higher. For an existing covered call, a strong rally highlights the cost of the upside cap: the shares can be called away at the strike even if the market price moves higher. This describes the strategy’s trade-off, not a proposed trade in $META. [5,9]
Premium is a buffer, not capital protection
A cash-secured put reserves enough cash for the purchase obligation and can still suffer a substantial loss if the stock falls. A covered call holds the corresponding shares, gives up upside beyond the strike and retains substantial stock downside. Neither becomes low-risk just because volatility or the available premium is higher. [8,9]
Bottom line: the 2026-09-09 session combined lower benchmarks, a higher VIX and rising Treasury yields with a sharp $META rally. The educational takeaway is to separate market direction, single-stock ownership risk and the obligation embedded in each option. This wrap proposes no strike, expiry, premium or expected trade return.
Sources
- [1]S&P 500 — 2026-09-09 — Cboe · Accessed 2026-09-09T21:38:03.318609+00:00 · Tier 1
- [2]Nasdaq-100 — 2026-09-09 — Cboe · Accessed 2026-09-09T21:38:03.335340+00:00 · Tier 1
- [3]VIX — 2026-09-09 — Cboe · Accessed 2026-09-09T21:38:03.305044+00:00 · Tier 1
- [4]$AAPL — 2026-09-09 — Cboe · Accessed 2026-09-09T21:38:03.286387+00:00 · Tier 1
- [5]$META — 2026-09-09 — Cboe · Accessed 2026-09-09T21:38:03.311307+00:00 · Tier 1
- [6]Treasury par yields / Taux au pair du Trésor — 2026-09-09 — U.S. Treasury · Accessed 2026-09-09T21:38:21.484644+00:00 · Tier 1
- [7]VIX: expected volatility / volatilité attendue — Cboe · Accessed 2026-09-09T21:38:04.396112+00:00 · Tier 1
- [8]Cash-secured put / Put garanti en espèces — Options Industry Council · Accessed 2026-09-09T21:38:03.607955+00:00 · Tier 1
- [9]Covered call / Call couvert — Options Industry Council · Accessed 2026-09-09T21:38:03.710557+00:00 · Tier 1
- [10]Photograph / Photographie : New York Stock Exchange — CC BY 4.0 — Jakub Hałun / Wikimedia Commons · Accessed 2026-09-09T21:39:05.691469+00:00 · Tier 1
This content is for informational and educational purposes only and is not financial advice. Options involve risk and are not suitable for every investor. Do your own research before trading.
Read next

Relief spreads, but index options resist the all-clear
The rebound widened as volatility fell, yet index options remained more put-heavy than stock options. For premium sellers, calmer prices do not establish a one-way market.

Cheaper oil lifts futures, but Japan adds another rate hurdle
Falling oil and stronger equity futures extend the relief rally even as Japan tightens monetary policy. For premium sellers, calmer broad-market volatility must still be weighed against elevated bond yields and company-specific risks.

Equal-weight resilience challenges the tech-led retreat
Equal-weight stocks held up as technology shares fell and volatility rose. For option sellers, the split exposes concentration risk rather than a clear signal of panic or confidence.