
Wheelhouse Weekly · November 8, 2026
The week ahead, November 9–13, built from Friday’s closing data. Every time below is Toronto time (EST). English first; the full French version follows.
The week in three lines
- Thursday was Wall Street’s worst day since April 2025. The S&P 500 fell 4.4% and the Nasdaq 5.5%, on fears that the midterm results would slow the AI data-center buildout. The VIX jumped from 16.61 to 28.18.
- The damage was narrow. Chip and AI-cloud names on Eddie’s watchlist lost about 15% to 19% that day; Apple, Amazon, Microsoft and Alphabet lost 1.5% to 3.6%. All three of last week’s put studies are worth less than their credit.
- A packed week ahead. $RKLB and $ASTS on Monday, October inflation (CPI) and $CRWV on Tuesday, $NBIS before Thursday’s open, and producer prices (PPI) on Friday.
The scoreboard · week to Friday, November 6
S&P 500 · −2.7% on the week
7,377
Nasdaq · −3.4% on the week
24,579
VIX · +6.22 pts on the week
25.64
10-year yield · −0.08 pt
4.86%
Friday brought a partial bounce: the S&P 500 rose 0.3% and the Nasdaq 1.1%. That morning’s jobs report was strong: 165,000 jobs added in October, against 59,000 expected, with unemployment at 4.1%. Hourly pay rose 0.4% in a month and 3.1% in a year.
The lead · Fear came back, and put prices rose with it
Tuesday’s midterms set it up. On Wednesday, stocks rallied after a decisive Democratic win, and the S&P 500 gained 1.6%. On Thursday, they reversed hard. CNBC tied the selloff to fears that the Democratic sweep of Congress and key governorships could slow the data-center buildout and bring more AI regulation. All three major averages had their worst day since April 2025, all 11 sectors of the S&P 500 fell, and the Nasdaq closed in correction, more than 10% below its October record.
The damage was narrow. Chip and AI-cloud names on Eddie’s watchlist lost about 15% to 19% in that one session. The tech giants lost 1.5% to 3.6%, and over the full week $AMZN even rose 7.9%.
Thursday, November 5: one session, two markets
Close to close, Wednesday Nov 4 to Thursday Nov 5. $LITE, $CRDO and $MU make chips and optical parts for AI data centers; $NBIS rents out AI computing.
Source: Nasdaq daily closes; Yahoo Finance history
For put sellers, a day like Thursday changes two things at once. Option prices jump, because traders now expect bigger swings: the VIX, Wall Street’s fear gauge, rose 70% in one session. And the risk behind those prices is real, as Thursday proved. A put that pays more is not a better deal; it pays more because the stock can fall further. Setup #1 shows both sides on one contract.
Setup #1 · $NBIS $105 put, December 18
Watch-only: the report comes first. One $105 put expiring December 18, 2026. If assigned, you buy 100 shares at $105. Prices are Friday-close Cboe delayed quotes; reprice at Monday’s 9:30 a.m. open and assume no fill.
Cash to reserve
$10,500
Credit at the bid
$900
Breakeven at expiry
$96.00
Max loss (stock at $0)
$9,600
- Why it pays so much: $900 is 8.6% of the cash in 39 days, for a strike 18.9% below Friday’s close. Implied volatility on this contract is 122%. The price covers Thursday-style swings and the results due Thursday, November 12, before the open.
- Why own the shares: Nebius rents out AI computing power. In its last reported quarter, ended June 30, revenue was $582.3 million, 5.5 times a year earlier, but it lost $190.4 million from continuing operations. Thursday’s report will show whether growth still outruns the cost of building capacity.
- Trend: Friday close $129.49, down 16.0% on the week and 54.8% below its 52-week closing high. It sits below its 20-, 50- and 200-day averages ($165.23 / $201.70 / $178.38). RSI(14) 34.0: weak, not yet oversold.
- Contract: bid/ask $9.00/$9.40, a $0.40 spread, with 2,162 contracts open but only 30 traded on Friday. Delta −0.24. The breakeven sits 25.9% below Friday’s close.
One put at expiry, before fees
Per contract, before fees and taxes. $80 is 38.2% below Friday’s close. Scenarios, not forecasts; the $9,600 maximum loss is not plotted. Early assignment is possible.
Source: Cboe delayed quote, November 6 close; YieldCove arithmetic
Why it stays watch-only
Selling before Thursday’s report is a bet on the numbers. Implied volatility often drops once results are out, so the same put may pay much less afterwards: that is the price of waiting for the news. Reconsider after the report if the stock holds above Thursday’s $120.37 close. CPI on Tuesday and PPI on Friday can move every stock. Pass if $9,600 of Nebius stock at the breakeven would be too big a part of your account.
2 more setups for PRO members
- $AAPL $320 put, Dec 18: $470 on $32,000 of cash, breakeven 7.9% below Friday’s close. Apple fell just 1.5% on Thursday, and its put pays about a sixth of $NBIS’s rate: the price of calm. A study, with the deepest quote of the three.
- $AKAM $75 put, Dec 18: $300 on $7,500, breakeven 13.3% below. The report is behind it, but the quote is wide ($3.00/$3.70): a study for limit orders only. The post also shows why the December monthly beats the weekly here.
[Read all three setups in full →](https://yieldcove.com/en/tips/nbis-week-ahead-wheel-setups-november-8-2026-2026-11-08) Strike logic, risk checks and what would change each plan. Opens Sunday at 8:00 a.m.; full access with YieldCove PRO.
Last week’s setups · the check-up
Thursday’s rout hit chips, not the giants. All three of last week’s puts, expiring November 20, were worth less than their credit at Friday’s close, even though their implied volatility rose. The $AMZN $230 put that paid $360 was quoted near $1.20, a paper gain of about $240 per contract (67% of the credit), with $AMZN up 7.9% on the week. The $MSFT $500 put that paid $590 was near $4.45, about $145 ahead (25%). The $GOOGL $265 put, which stayed watch-only, paid $305 and was near $2.19, about $86 ahead (28%). All three have 11 days to run from Monday.
The week ahead · Toronto time (EST)
- Monday, November 9: $RKLB reports after the close (call 5:00 p.m.); $ASTS holds its business-update call at 5:00 p.m.
- Tuesday, November 10: October consumer prices (CPI) at 8:30 a.m.; $CRWV holds its results call at 5:00 p.m.
- Thursday, November 12: $NBIS reports before the open (call 8:00 a.m.). The same day, $AAPL’s $0.27 dividend goes ex.
- Friday, November 13: October producer prices (PPI) at 8:30 a.m.
Where only a call time is listed, the company has not said whether results come before the open or after the close. The next Fed meeting ends December 9.
Watchlist · what changed
- $LITE / $MRVL: on Monday, November 2, Marvell agreed to buy Lumentum for 4.5 Marvell shares per Lumentum share, a deal both expect to close in the first half of 2028, pending approvals. It is paid in stock, so its value moves with Marvell’s price. $MRVL fell 28.1% on the week and $LITE 35.9%.
- $MU / $CRDO: each lost about a fifth of its value on the week (−22.0% and −20.2%), most of it on Thursday (−17.5% and −17.7%).
- $AAPL: sales rose 12% to $114.5 billion in the quarter reported November 2. The stock ended the week 0.7% lower, at $342.37.
- $AKAM: AI cloud sales grew 34% to $109 million in the quarter reported Thursday, still under a fifth of its $622 million security business. The stock fell 9.4% on report day, then rose 6.7% on Friday.
From Eddie’s tracker
One trade closed this week, on the day of the selloff. On Thursday, November 5, Eddie bought back a $NBIS $150 covered call he had sold on March 20 for $26.60 a share ($2,660). Closing it cost $13.20 ($1,320): $1,338.02 kept after fees, in 230 days. A record of his closed trades, not a recommendation.
Free tool: before you sell a put into a report, write down the cash at stake, your breakeven and your exit line in the free wheel spreadsheet. Missed an issue? Browse the archive.
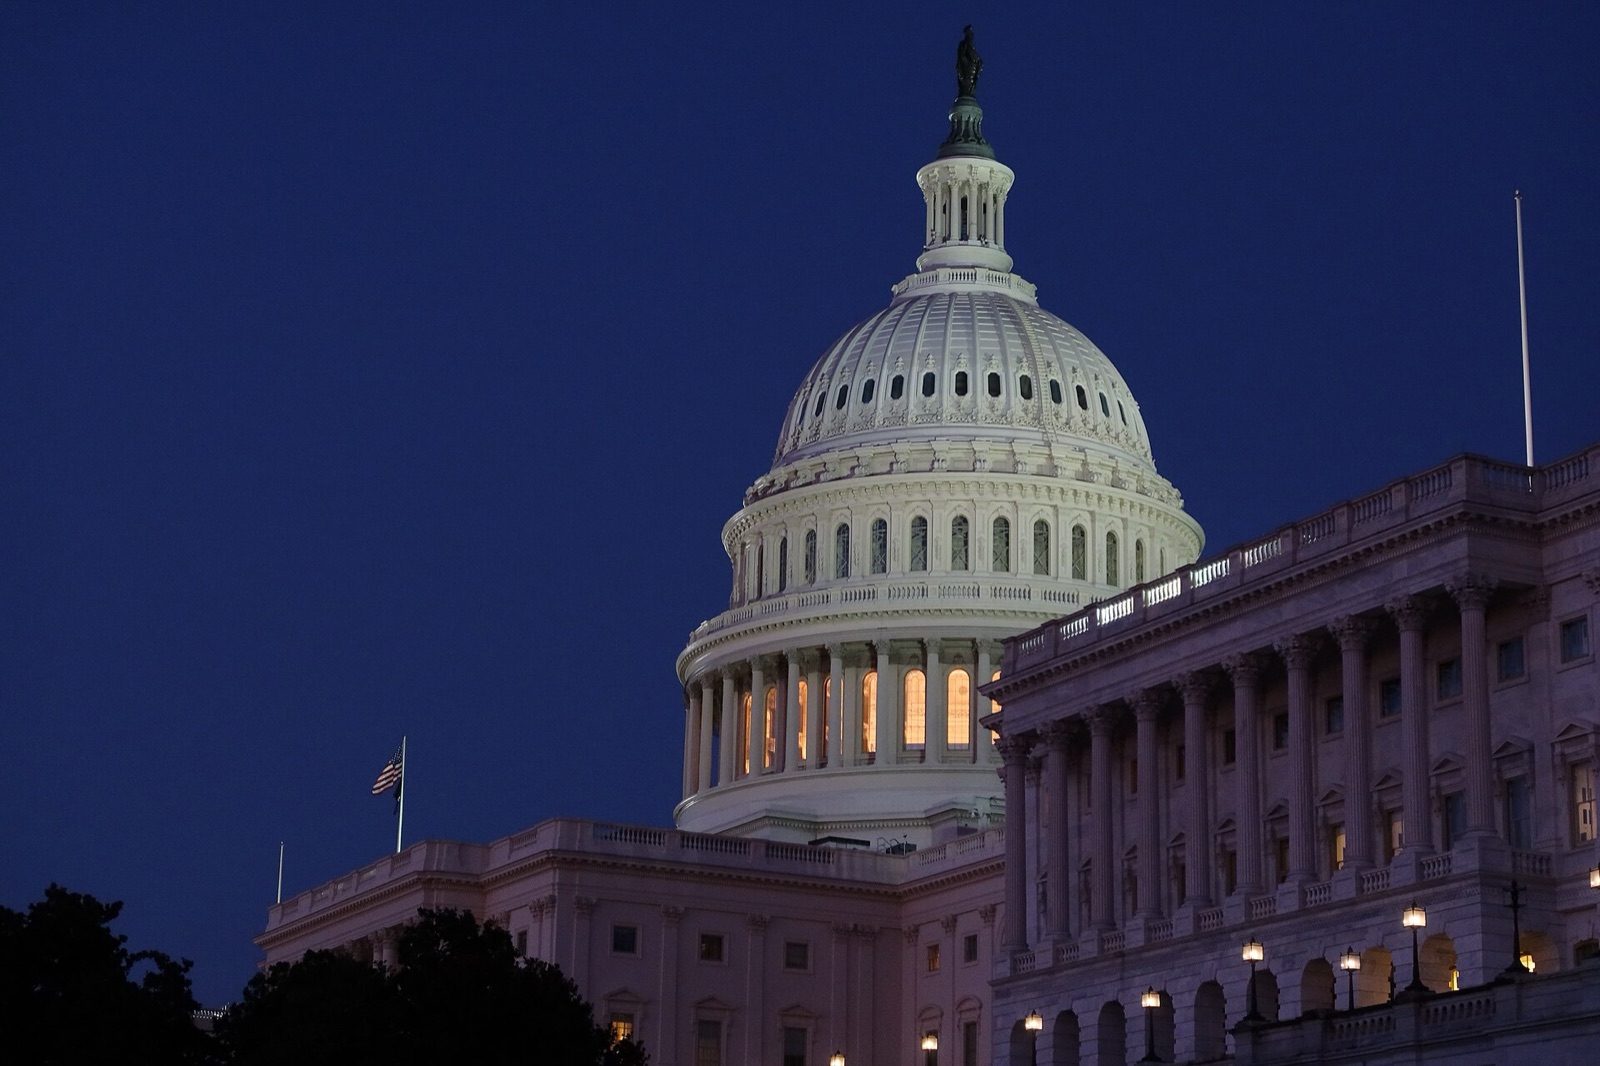
Photo: the U.S. Capitol at dusk, October 2024. peakfocus.agency / Wikimedia Commons, CC BY 4.0; resized.
AI-assisted editorial: researched by Codex, edited by Claude. Educational information, not personalized investment advice. Figures exclude fees and taxes; early assignment is possible. No trades were executed for this newsletter.
Sources
- [1]Markets, Thu Nov 5: worst day since April 2025 / La pire séance depuis avril 2025 — CNBC · Accessed 2026-11-07 · Tier 2
- [2]Markets, Fri Nov 6: Nasdaq rebounds; jobs beat / Rebond du Nasdaq; emploi — CNBC · Accessed 2026-11-07 · Tier 2
- [3]Employment Situation, October 2026 / Situation de l’emploi — U.S. Bureau of Labor Statistics · Accessed 2026-11-07 · Tier 1
- [4]BLS release schedule, November 2026 / Calendrier du BLS — U.S. Bureau of Labor Statistics · Accessed 2026-11-07 · Tier 1
- [5]10-year Treasury par yield / Taux à 10 ans — U.S. Treasury · Accessed 2026-11-07 · Tier 1
- [6]FOMC meeting calendar / Calendrier du FOMC — Federal Reserve · Accessed 2026-11-07 · Tier 1
- [7]S&P 500 daily closes / Clôtures quotidiennes — Cboe · Accessed 2026-11-07 · Tier 1
- [8]VIX daily closes / Clôtures quotidiennes — Cboe · Accessed 2026-11-07 · Tier 1
- [9]Nasdaq Composite daily closes / Clôtures quotidiennes — Nasdaq · Accessed 2026-11-07 · Tier 1
- [10]Nebius Q3 2026 date / Date des résultats — Nebius · Accessed 2026-11-07 · Tier 1
- [11]Nebius Q2 2026 results / Résultats T2 2026 — Nebius / SEC · Accessed 2026-11-07 · Tier 1
- [12]Apple Q4 FY26 results and dividend / Résultats et dividende — Apple · Accessed 2026-11-07 · Tier 1
- [13]$AAPL dividend history: ex-date Nov 12 / Historique des dividendes — Nasdaq · Accessed 2026-11-07 · Tier 1
- [14]Akamai Q3 2026 results / Résultats T3 2026 — Akamai · Accessed 2026-11-07 · Tier 1
- [15]Marvell–Lumentum merger agreement, 8-K / Accord de fusion — Marvell / SEC · Accessed 2026-11-07 · Tier 1
- [16]Marvell–Lumentum announcement: 4.500 shares, H1 2028 close / Annonce — Marvell / SEC · Accessed 2026-11-07 · Tier 1
- [17]Rocket Lab Q3 date / Date des résultats — Rocket Lab / Nasdaq · Accessed 2026-11-07 · Tier 1
- [18]AST SpaceMobile Q3 call / Conférence — AST SpaceMobile / Nasdaq · Accessed 2026-11-07 · Tier 1
- [19]CoreWeave Q3 call / Conférence — CoreWeave / Nasdaq · Accessed 2026-11-07 · Tier 1
- [20]$NBIS options, Nov 6 close (delayed) — Cboe · Accessed 2026-11-07 · Tier 1
- [21]$AAPL options, Nov 6 close (delayed) — Cboe · Accessed 2026-11-07 · Tier 1
- [22]$AKAM options, Nov 6 close (delayed) — Cboe · Accessed 2026-11-07 · Tier 1
- [23]$AMZN options, Nov 6 close (delayed) — Cboe · Accessed 2026-11-07 · Tier 1
- [24]$MSFT options, Nov 6 close (delayed) — Cboe · Accessed 2026-11-07 · Tier 1
- [25]$GOOGL options, Nov 6 close (delayed) — Cboe · Accessed 2026-11-07 · Tier 1
- [26]$NBIS daily history — Yahoo Finance · Accessed 2026-11-07 · Tier 2
- [27]$AAPL daily history — Yahoo Finance · Accessed 2026-11-07 · Tier 2
- [28]$AKAM daily history — Yahoo Finance · Accessed 2026-11-07 · Tier 2
- [29]$AMZN daily history — Yahoo Finance · Accessed 2026-11-07 · Tier 2
- [30]$MSFT daily history — Yahoo Finance · Accessed 2026-11-07 · Tier 2
- [31]$GOOGL daily history — Yahoo Finance · Accessed 2026-11-07 · Tier 2
- [32]$LITE daily history — Yahoo Finance · Accessed 2026-11-07 · Tier 2
- [33]$MRVL daily history — Yahoo Finance · Accessed 2026-11-07 · Tier 2
- [34]$MU daily history — Yahoo Finance · Accessed 2026-11-07 · Tier 2
- [35]$CRDO daily history — Yahoo Finance · Accessed 2026-11-07 · Tier 2
- [36]Eddie’s tracker (closed trades) — YieldCove · Accessed 2026-11-07 · Tier 1
- [37]Cash-secured put basics / Les bases — Options Industry Council · Accessed 2026-11-07 · Tier 1
- [38]Hero photo: U.S. Capitol at dusk, Oct 2024 (CC BY 4.0) — Wikimedia Commons · Accessed 2026-11-07 · Tier 1
This content is for informational and educational purposes only and is not financial advice. Options involve risk and are not suitable for every investor. Do your own research before trading.