
SOFI wheel watch: rich IV, earnings in two weeks
SOFI's liquid August 21 $17 put sits near 30 delta with IV above its three-month norm, but the contract crosses expected July 29 earnings.
YieldCove Desk
3 min read
Cboe delayed reference
$18.55 · Jul. 14 after close
30-day IV
67.60%
3-month IV average
60.23%
Expected earnings
Jul. 29 before open · 15 days
The setup in one sentence
SOFI offers a liquid August 21 put near 30 delta while implied volatility sits above its recent three-month average, but the contract crosses an expected July 29 earnings report. That makes this an earnings-aware ownership test, not a routine premium sale. The useful question is whether assignment around a $16.12 midpoint breakeven would still be acceptable after a gap, a volatility contraction and a fresh review of the quarter. The figures below are a delayed educational snapshot, not a live quote, recommendation or order instruction.
Why SOFI is on the wheel watch
SoFi's latest Form 10-Q describes a financial-services platform spanning Lending, a Technology Platform and Financial Services. That mix gives the equity several moving parts: consumer-credit performance, deposit and funding economics, member engagement and the performance of its technology customers can all change the ownership case. A wheel framework therefore cannot stop at a high option premium. Assignment means owning the operating company through those risks, not merely collecting a short-dated credit.
The July 14 price picture is constructive over the short term but incomplete over the longer term. Yahoo's daily series closed at $18.55, above the 20-day average of $17.90 and the 50-day average of $16.95; the 8-day EMA of $18.29 also stood above the 21-day EMA of $17.88. RSI(14) was 57.1, which is firm without being an oversold entry signal. The stock remained below its roughly $21.97 200-day average, however. June lows between about $15.65 and $16.82 make the $16-$17 area a reference band, not a guaranteed floor.
Volatility is above its recent norm
Cboe's delayed chain showed 30-day implied volatility at 67.60%. AlphaQuery's July 13 observation was 70.36%, versus a 60.23% average across 62 sessions from April 14 through July 13; that latest reading ranked near the 92nd percentile of the sample. The two independent sources therefore support describing volatility as elevated relative to the recent regime. They do not prove that the option is cheap or that volatility cannot rise further—especially with earnings inside the contract window.
Earnings is inside the expiry window
Nasdaq labels July 29, 2026 before market open as an expected SOFI report date, 15 calendar days after this snapshot and before the August 21 expiry. The wording is expected rather than a company-confirmed event in this check. Reconfirm the date and chain before treating any premium as usable; an earnings gap can overwhelm the displayed cushion, and post-event IV contraction can change mark-to-market behaviour.
One exact August 21 reference
| Strike | Delta | Bid-ask | Mid | OI / volume | Strike cushion | Breakeven |
|---|---|---|---|---|---|---|
| $17 | -0.300 | $0.87-$0.89 | $0.88 | 6,977 / 1,124 | 8.36% | $16.12 |
At the displayed midpoint, one contract corresponds to about $88 of gross illustrative credit against $1,700 of nominal cash-secured collateral before fees. The 5.18% credit-to-strike reference moves the midpoint ownership basis to $16.12, about 13.1% below the $18.55 underlying reference. Liquidity was measurable: open interest was 6,977 contracts, volume 1,124 and the $0.02 bid-ask width equalled roughly 2.27% of midpoint. Those numbers describe the snapshot; they do not guarantee execution or protect against assignment below the breakeven.
What must be true for the framework to survive
The $17 strike is close to the recent $16-$17 trading band and below the 20-day price average, but it remains above the June intraday low. The framework weakens if SOFI loses that band without a quick reclaim, if the earnings date or guidance changes, if option spreads widen materially, or if credit conditions alter the ownership thesis. Most importantly, the account must be able to own 100 shares through an earnings-sized decline without relying on an immediate rebound. If that is not true, the premium is not compensation—it is an invitation to unwanted leverage.
Bottom line
SOFI is a valid research candidate because the August 21 $17 put was liquid, its near-30-delta line maps to a visible recent price band, and two current-run volatility checks show IV above the three-month norm. It is not a clean green light because the expiry crosses an expected earnings event and the stock still trades below its 200-day average. Treat $17/$16.12 as an educational strike-and-breakeven reference to recheck, not as a standing instruction. No sizing or trade is appropriate without current quotes, a reconfirmed event date and an acceptable assignment case. Because the line sits inside the event window, spot, delta, IV, spread, open interest, earnings timing and the ownership thesis must be refreshed together. A stale premium or date invalidates the screen even if this article remains published.
Sources
- [1]SOFI delayed quote, options chain and 30-day IV — Cboe · Accessed 2026-07-14 · Tier 1
- [2]SOFI one-year daily prices — Yahoo Finance · Accessed 2026-07-14 · Tier 3
- [3]SOFI 30-day mean implied-volatility series — AlphaQuery · Accessed 2026-07-14 · Tier 3
- [4]SOFI current earnings-date record — Nasdaq · Accessed 2026-07-14 · Tier 2
- [5]SoFi Form 10-Q for the quarter ended March 31, 2026 — SEC EDGAR · Accessed 2026-07-14 · Tier 1
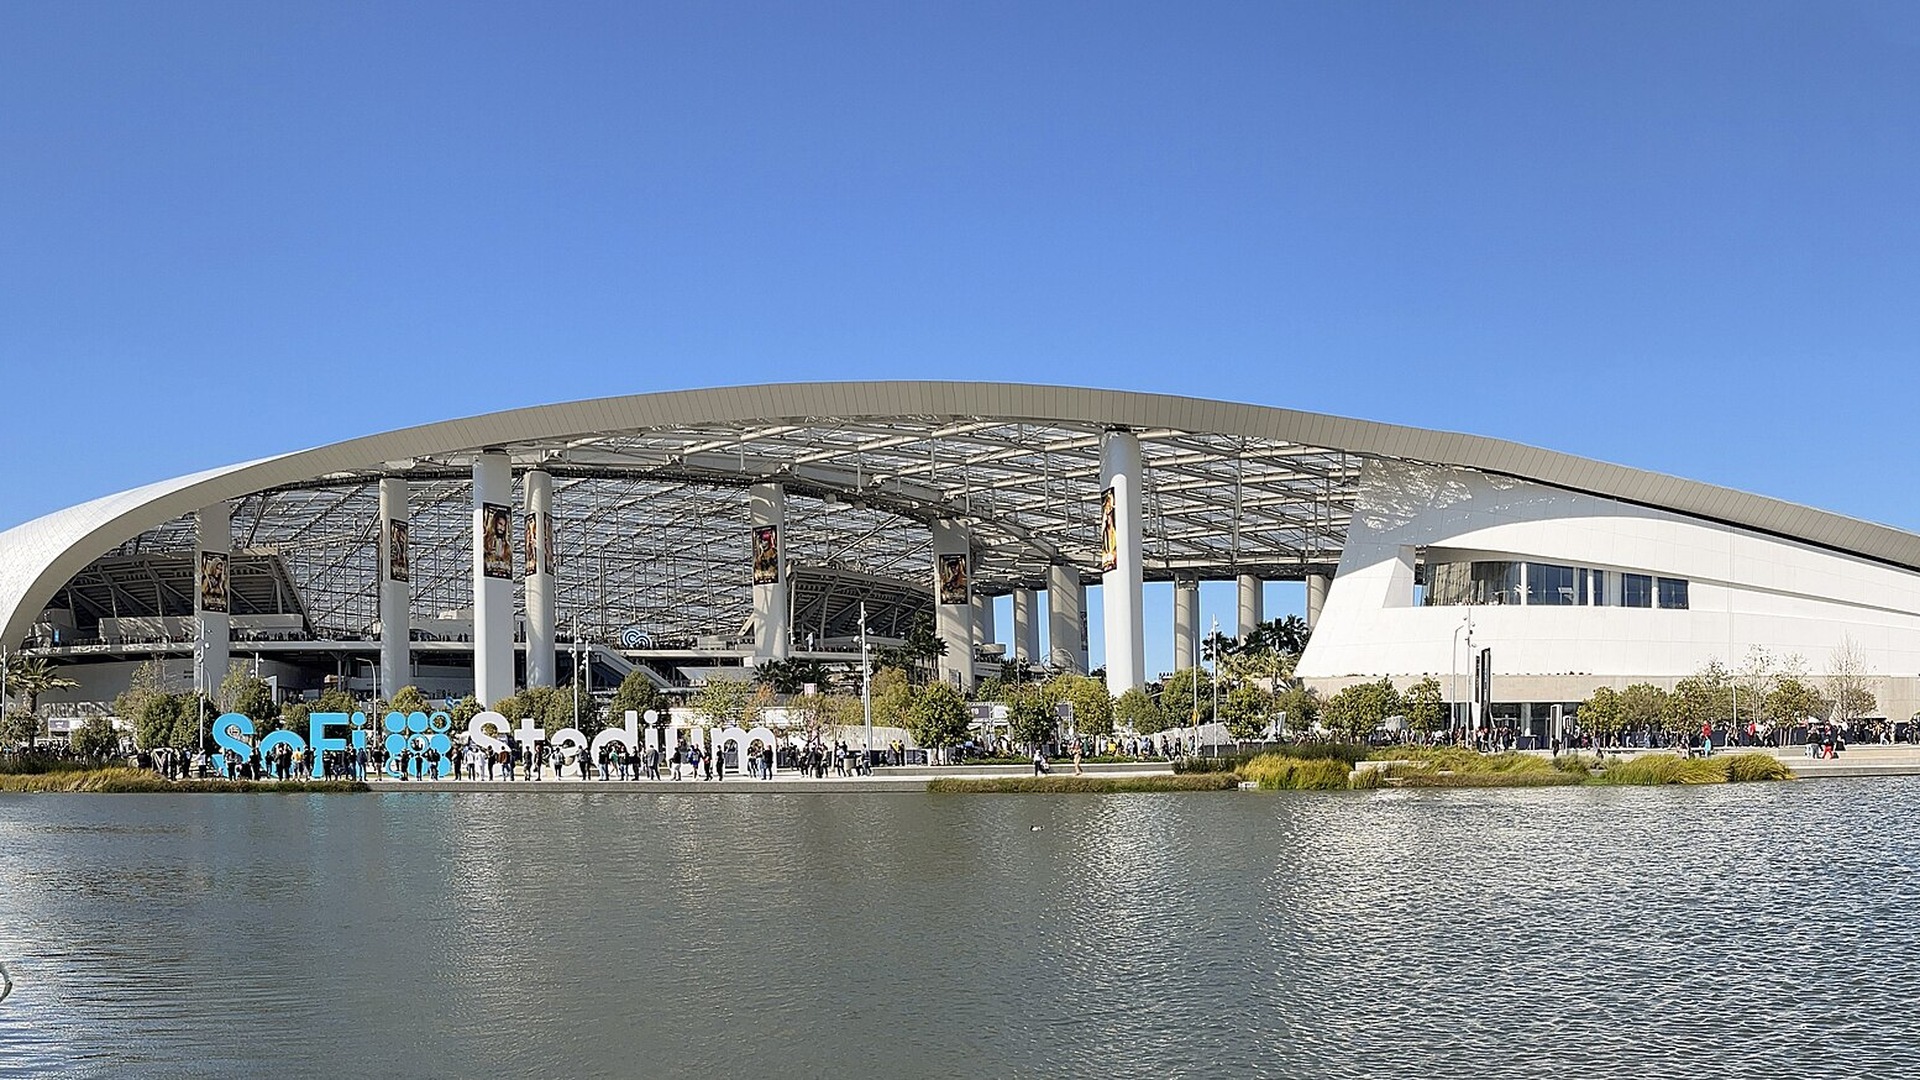
- [6]Real exterior photograph of SoFi Stadium — Wikimedia Commons · Accessed 2026-07-14 · Tier 2
This content is for informational and educational purposes only and is not financial advice. Options involve risk and are not suitable for every investor. Do your own research before trading.
More tips from the desk

Open Interest Is Not a Queue of Buyers
Sixty contracts can trade while open interest ends exactly where it started. For wheel sellers, outstanding positions are not a promise of liquidity or an easy exit.

At Expiration, the Closing Price Is Not Confirmation
Exercise-by-exception sets a default, not a guaranteed assignment outcome. One put example separates the closing price, the holder’s choice and the full cash payment if assigned.

Put Delta Is Not an Assignment Forecast
Delta estimates price sensitivity, not a promise about assignment. A −0.30 example separates a $30 price response from the full $5,000 purchase obligation.