Key takeaways
- AMAT rose 6.05% on November 11, ahead of today’s earnings call.
- The August revenue guide was USD9.75–10.75 billion; that is an expectation, not a reported result.
- Peer gains point to a broader equipment rebound, not proof of an AMAT earnings surprise.
- Earnings-gap risk matters more than an attractive-looking option premium.
November 11 close
USD395.08
Close-to-close move
+6.05%
+USD22.55
Daily volume / prior 20-session average
7.3764m / 8.5441m
0.86 times
Cboe 30-day implied volatility
62.64%
Snapshot retrieved November 12, 06:27 ET
Next earnings call
November 12, 16:30 ET
August Q4 revenue guidance midpoint
USD10.25bn
A rebound before the real test
Applied Materials enters Thursday, November 12 with a strong prior-session gain and a major unanswered question: can its earnings outlook support the recovery? AMAT closed November 11 at USD395.08, up USD22.55, or 6.05%, from the previous close. The company has scheduled its fourth-quarter and fiscal-2026 earnings call for today at 4:30 p.m. Eastern; these are not yet reported fourth-quarter results. Price data; earnings notice.
Yahoo Finance’s daily bar records 7,376,400 shares for November 11, against an average of 8,544,100 over the preceding 20 sessions. That is about 0.86 times the average: the price rebound did not come with above-average turnover on this measure. These are dated regular-session observations, not live Thursday quotes, and provider volume figures can be revised.
Why the sector matters
The move was not confined to Applied. Lam Research gained 6.07% and KLA rose 5.24% from November 10 to November 11, using unadjusted daily closes. That shared rebound is evidence of a sector move, but it does not identify one definitive cause or prove investors already know Applied’s results. Lam data; KLA data.
Chip-equipment rebound: November 11, 2026
Close-to-close changes from November 10; percentages, not forecasts.
Source: Yahoo Finance unadjusted daily closes, November 10–11, 2026; retrieved November 12 at 06:27 ET. Calculations: YieldCove.
Applied’s underlying growth case is more specific than a generic AI headline. In its October 13 investor presentation announcement, management identified leading-edge chip production, DRAM memory and advanced packaging as areas expected to drive around 75% of wafer-fab-equipment growth over 2025–2030. It also targeted approximately 54% non-GAAP gross margin and 40% non-GAAP operating margin by 2030; those are long-term ambitions, not this quarter’s achieved margins. October update.
- Demand driver: more complex chips and packaging create opportunities for materials-engineering tools, according to Applied’s October update.
- Execution test: stronger demand still has to translate into delivered equipment, revenue and cash.
- Comparison discipline: a peer rally is context, not a substitute for reading Applied’s own report.
The numbers the report must answer
Applied’s August 13 results release reported third-quarter revenue of USD9.115 billion, versus USD7.302 billion a year earlier, a rounded 25% increase. GAAP diluted earnings were USD3.17 a share, while adjusted, non-GAAP earnings were USD3.50; the two measures should not be mixed. Management then guided fourth-quarter revenue to USD10.25 billion, plus or minus USD500 million, and non-GAAP EPS to USD4.02, plus or minus USD0.20. Filed results.
| Measure | Q3 reported | Q4 guidance |
|---|---|---|
| Revenue | 9.115 billion | 9.75–10.75 billion |
| Non-GAAP diluted EPS | 3.50 | 3.82–4.22 |
| GAAP diluted EPS | 3.17 | Not provided in this guide |
The immediate test is both the result against that earlier range and what management says about the next quarter. A strong historical quarter does not by itself establish stronger future orders, and non-GAAP profit is not interchangeable with operating cash flow. The release flags export rules, customer spending and delivery constraints among risks to the outlook.
What it means for option sellers
Cboe’s delayed snapshot retrieved November 12 at 06:27 ET showed 30-day implied volatility of 62.637%, rounded here to 62.64%. That annualized estimate describes expected variability, not a predicted direction or a probability of profit; it is not an executable option quote. A comparable IV-rank history was not verified, so no claim that volatility is unusually high or cheap is justified. Cboe snapshot.
A cash-secured put exchanges premium income for an obligation to buy shares if assigned, while a covered call can require delivery of shares and caps upside at its strike. For the wheel, the critical distinction is whether an expiration spans tonight’s earnings event; a falling volatility estimate afterward cannot guarantee a profit if the stock gaps sharply. The USD380 put and USD420 call are educational strike illustrations only, not recommendations or validated entry prices. Put mechanics; covered calls.
Illustrative math, not a quote
Assume one standard 100-share USD380 put sells for an invented USD5 per share. Gross strike cash is USD38,000, premium is USD500 and expiration breakeven is USD375 per share; maximum profit is USD500 and loss could reach USD37,500 if shares become worthless. Fees and taxes are excluded; this is not a current bid, ask or trade setup.
The main risk
An earnings gap can pass straight through a put strike. Assignment does not make a loss disappear, and a covered call cannot fully protect against a large share-price decline.
- Risk: export restrictions, weaker customer budgets or shipment delays could undermine the outlook.
- Review plan: compare the actual release, next-quarter guidance and GAAP-to-non-GAAP reconciliation before interpreting the headline.
- Contract check: distinguish an earnings-spanning expiry from a later entry, and rebuild live prices, liquidity and collateral before any trading decision.
A larger premium is compensation for bearing risk, not proof that the risk is worth taking.
What to watch next
Today’s 4:30 p.m. ET call is the company-specific checkpoint; the issuer says a replay will be available by 8 p.m. ET. The next morning brings a separate macro test: October producer-price data are scheduled for November 13 at 8:30 a.m. ET. October consumer prices, released November 10, had already risen 0.4% month over month seasonally adjusted, with prices excluding food and energy up 0.3%; those are monthly figures, not annual rates. Call details; BLS calendar; CPI release.
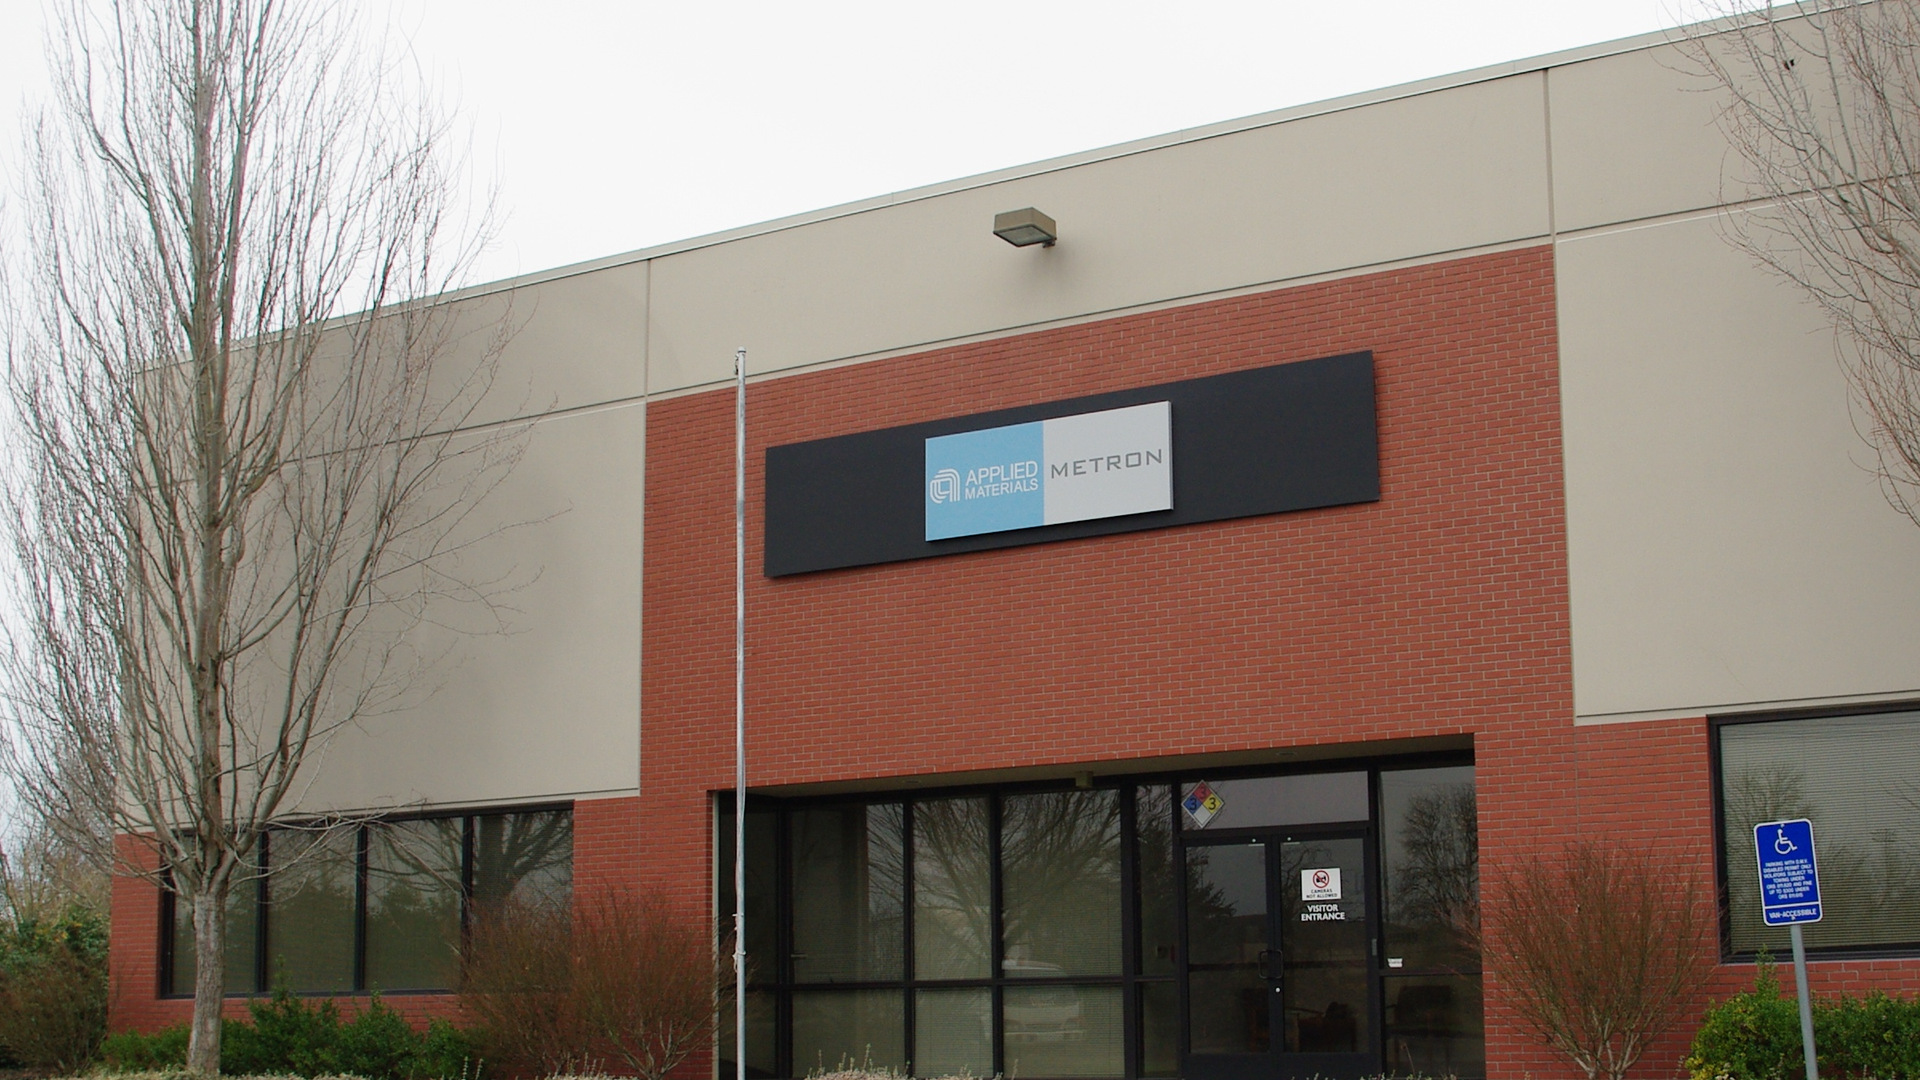
Archival photo: Applied Materials Metron office - Hillsboro, Oregon.JPG, by M.O. Stevens, photographed December 19, 2010; via Wikimedia Commons, CC BY-SA 3.0 Unported. Cropped to 16:9, resized and JPEG-encoded; the derivative is distributed under CC BY-SA 3.0. This office exterior is not a current fab or equipment image; no endorsement implied.
Sources
- [1]November 12 fiscal-2026 earnings-call notice — Applied Materials · Accessed 2026-11-12T11:27:07.058217+00:00 · Tier 1
- [2]August 13 Q3 FY2026 results and Q4 guidance, Exhibit 99.1 — Applied Materials / SEC · Accessed 2026-11-12T11:27:06.996641+00:00 · Tier 1
- [3]October 13 investor presentation announcement and 2030 targets — Applied Materials · Accessed 2026-11-12T11:29:37.946479+00:00 · Tier 1
- [4]AMAT daily prices and volume, snapshot November 12 — Yahoo Finance · Accessed 2026-11-12T11:27:07.540445+00:00 · Tier 3
- [5]LRCX daily prices, snapshot November 12 — Yahoo Finance · Accessed 2026-11-12T11:27:07.855343+00:00 · Tier 3
- [6]KLAC daily prices, snapshot November 12 — Yahoo Finance · Accessed 2026-11-12T11:27:07.783593+00:00 · Tier 3
- [7]AMAT delayed snapshot and 30-day implied volatility — Cboe · Accessed 2026-11-12T11:27:07.824948+00:00 · Tier 1
- [8]November 2026 release calendar — U.S. Bureau of Labor Statistics · Accessed 2026-11-12T11:27:07.174251+00:00 · Tier 1
- [9]October 2026 CPI, released November 10 — U.S. Bureau of Labor Statistics · Accessed 2026-11-12T11:27:07.398103+00:00 · Tier 1
- [10]Cash-secured put strategy — Options Industry Council · Accessed 2026-11-12T11:27:07.110763+00:00 · Tier 1
- [11]Covered call strategy — Options Industry Council · Accessed 2026-11-12T11:28:49.042391+00:00 · Tier 1
- [12]Archival photo: Applied Materials Metron office, Hillsboro — Wikimedia Commons · Accessed 2026-11-12T11:13:46.084963+00:00 · Tier 1
- [13]Creative Commons Attribution-ShareAlike 3.0 Unported licence — Creative Commons · Accessed 2026-11-12T11:13:46.214878+00:00 · Tier 1
This content is for informational and educational purposes only and is not financial advice. Options involve risk and are not suitable for every investor. Do your own research before trading.
Keep YieldCove close
Choose YieldCove as a preferred source for Top Stories in Google Search.
Run the numbers before you trade: the free wheel strategy calculator sizes the whole cycle, and the cash-secured put calculator shows the cash, return and breakeven of one put.