
Tech holds its ground, but market confidence stays narrow
Technology-heavy shares held steady while broader equity measures fell. For option sellers, that split makes participation and downside exposure more useful than a single bullish or bearish sentiment label.
YieldCove Desk
4 min read
Technology-heavy shares held their ground while much of the equity market slipped. That is a narrower expression of confidence than a broad recovery, and it matters to option sellers whose downside exposure belongs to a particular stock rather than to a reassuring headline. The clearest disagreement is between pockets of growth enthusiasm and the price of carrying risk elsewhere.
Morning sentiment — September 17, 2026, Eastern Time (America/Toronto). Market figures below describe the completed September 16, 2026 U.S. session, compared with September 15, 2026. They are closing observations, not live executable quotes. Social dates also use Eastern Time.
$VIX close
17.71
+2.97% on the session
Equity put/call ratio
0.69
Cboe contract volume
Index put/call ratio
1.02
Cboe contract volume
The scoreboard: resilience without broad participation
| Fund | Close (USD) | Daily change | Market proxy |
|---|---|---|---|
| $SPY | 754.05 | -0.44% | Capitalization-weighted large caps |
| $QQQ | 704.72 | +0.03% | Technology-heavy Nasdaq basket |
| $RSP | 212.28 | -0.79% | Equal-weight large caps |
| $IWM | 283.92 | -0.43% | Small caps |
| $DIA | 515.22 | -1.15% | Dow-linked large caps |
| $HYG | 78.42 | +0.05% | High-yield corporate bonds |
| $LQD | 104.45 | +0.16% | Investment-grade corporate bonds |
The tiny gain in $QQQ contrasts with declines in the capitalization-weighted $SPY and equal-weight $RSP. The latter lagged $SPY by about 0.34 percentage points. Giving each constituent a more similar weight therefore did not improve the session’s result. The weaker $DIA adds another reason not to describe the technology basket’s stability as market-wide confidence. These are comparisons among baskets, not a count of every advancing and declining stock.
Institutional signals: protection is not a head count
Cboe’s options statistics show different trading patterns across instruments. Single-stock options had more calls than puts, while index options were close to balanced and the combined $SPX and $SPXW category had more puts than calls. Those distinctions describe contract volume. They do not identify the purchaser, distinguish opening from closing trades, or establish whether a position is speculative or part of a hedge.
| Instrument group | Ratio | What it establishes |
|---|---|---|
| All products | 0.98 | Near-balanced aggregate volume |
| Index options | 1.02 | Slightly more put contracts |
| Equity options | 0.69 | More call contracts |
| $SPX + $SPXW | 1.28 | More put contracts |
It would be tempting to assign the calls to optimistic individuals and the puts to defensive institutions. The figures do not support that division. A professional portfolio can combine stock exposure with index protection; an individual can trade either instrument. The useful institutional lens is the coexistence of equity exposure, hedging instruments and funding costs—not a claim that a single group has collectively turned bullish or bearish.
The $VIX closed at 17.71, up 2.97% from 17.20. That increase sits alongside, rather than contradicts, the flat technology basket: anticipated index variability and the direction of one fund need not move together. Nor does a higher volatility index guarantee attractive compensation in any particular option. Expiration, strike, company-specific risk and the premium actually available still determine the exposure being sold.
Short-term yields rise; credit offers a counterweight
The Treasury’s two-year par yield rose 7 basis points to 4.74%, while its ten-year yield rose 1 basis point to 5.01%, leaving a 27-basis-point gap. These are annualized reference yields, not a brokerage account’s cash rate. The faster rise at the shorter maturity underlines the financing hurdle facing risk-taking, without identifying which investors changed their positions or why.
There is also contrary evidence to an indiscriminate retreat. High-yield bond fund $HYG gained 0.05% and investment-grade fund $LQD gained 0.16%. Those modest advances do not erase equity weakness, but they do not resemble a simultaneous price decline across these stock and bond baskets. Fund prices also reflect duration, distributions and composition; this comparison is not a direct credit-spread measure or evidence of net inflows.
Retail pulse: fear of loss meets belief in growth
Personal discussions make that tension concrete. In r/investing on September 17, 2026, u/onlyreason4u worried about protecting accumulated wealth after concentrating on the S&P 500. In the same community on September 16, 2026, u/CrypticSoldier described beginning a recurring retirement-investing habit. Anxiety about a drawdown and willingness to keep building equity exposure can coexist without either defining all retail investors.
The contrast is sharper in r/AMD_Stock. On September 16, 2026, u/Long_on_AMD embraced an ambitious long-term earnings narrative for $AMD, while u/JWcommander217 emphasized uncertainty around the market’s initial policy reaction. These are personal opinions, not established earnings forecasts or proof of orders being placed. Their useful message is about horizon: conviction in a distant business outcome can sit beside caution about the next price move.
Where the signals agree—and where they do not
| Question | Market evidence | Retail contrast |
|---|---|---|
| Is optimism broad? | $QQQ steady; $RSP and $DIA weaker | Growth conviction versus concern about concentration |
| Is protection unnecessary? | $VIX higher; $SPX/$SPXW puts exceed calls | Concern about preserving accumulated wealth |
| Is everyone leaving risk? | $HYG and $LQD higher | Recurring retirement investing continues as an individual intention |
| Is a direction settled? | Mixed baskets and instrument-level activity | Long horizons coexist with short-term caution |
What could change the picture
The September 17, 2026 session provides the next comparison, not a promised turning point. A recovery shared by equal-weight and small-cap baskets would give technology resilience broader support. Further weakness outside technology, accompanied by higher volatility, would strengthen the narrow-confidence interpretation. A calmer volatility close without wider equity participation would be a mixed result rather than a clean reversal of the argument.
The strongest counterargument is that a single session can exaggerate differences caused by sector weights and timing. Bond resilience and the small technology gain already challenge a simple panic narrative. Conversely, enthusiastic stock discussions do not establish durable buying power. Crowding concerns are plausible when attention concentrates on the same growth stories, but attention alone does not demonstrate a crowded position.
The premium seller’s distinction
A market can retain growth believers while pricing more uncertainty. Premium is compensation for a defined obligation, not a vote of confidence. The educational takeaway is to separate the sentiment story from the underlying downside and assignment exposure; none of these aggregate indicators establishes an individual trade’s attractiveness.
Bottom line: confidence has not vanished, but its reach is limited. Technology resilience, weaker broader equities, mixed options activity and contrasting personal horizons describe a divided market—not an identifiable institutional-versus-retail contest with a clear winner.
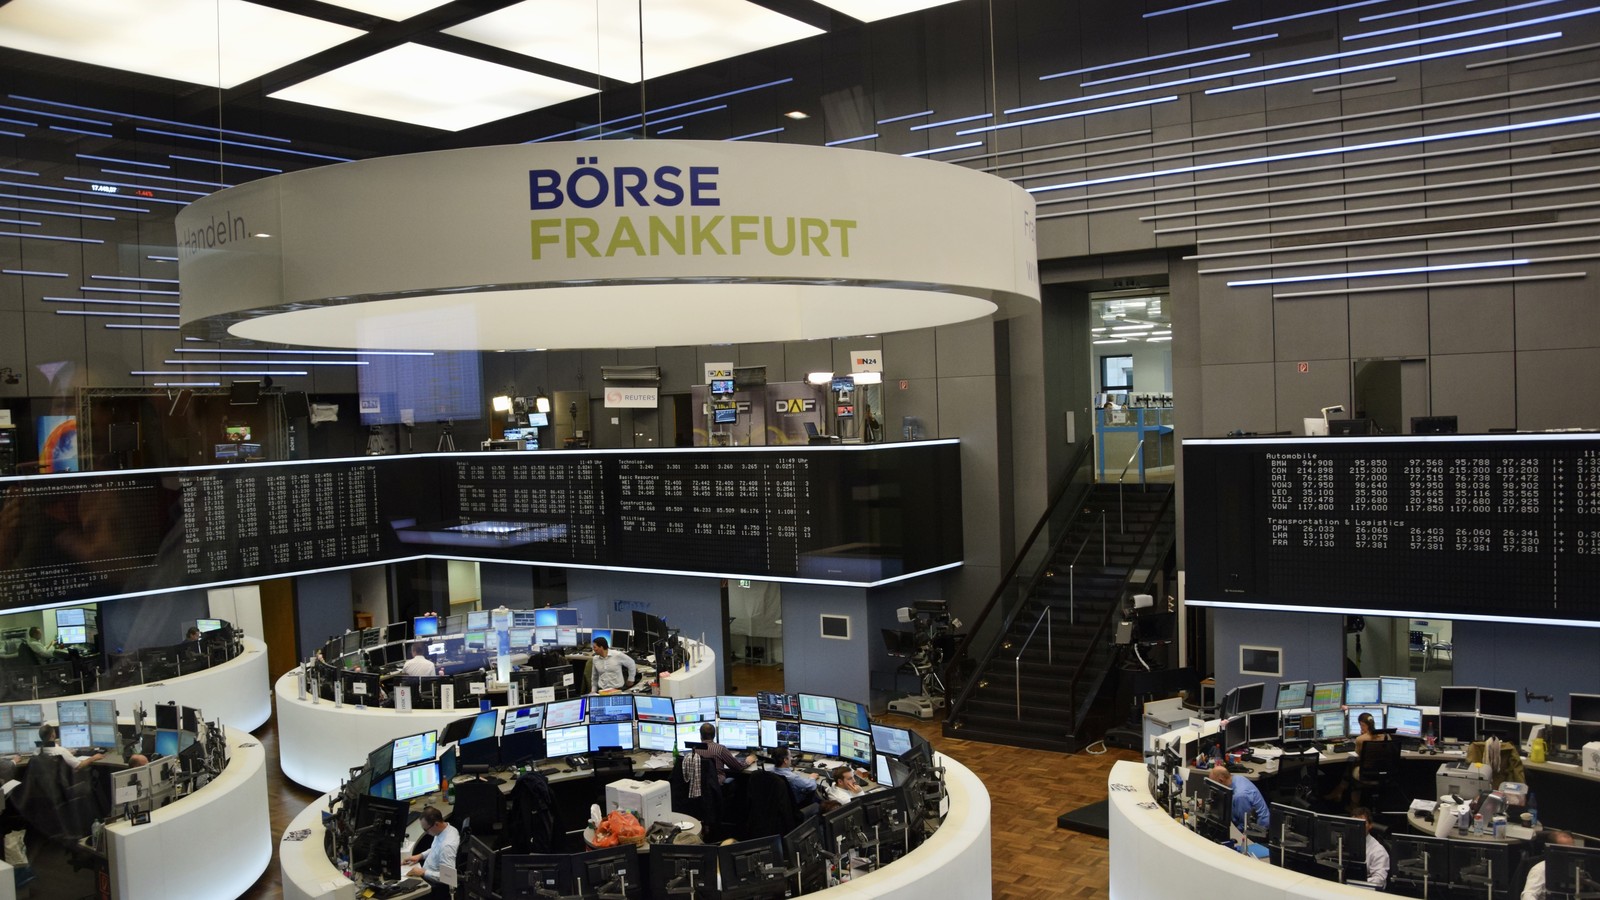
Featured photograph: Frankfurt Stock Exchange, November 17, 2015, by Ank Kumar. Archival market context; not the current U.S. session. Cropped and resized under CC BY-SA 4.0; the image adaptation retains that license.
Sources
- [1]Closing prices / Cours de clôture — 2026-09-16 — CNBC · Accessed 2026-09-17T09:05:33.253080+00:00 · Tier 2
- [2]Closing prices and daily changes / Clôtures et variations — 2026-09-16 — TradingView · Accessed 2026-09-17T09:05:33.253722+00:00 · Tier 2
- [3]$VIX daily closing history / Historique quotidien du $VIX — Cboe Global Markets · Accessed 2026-09-17T09:05:33.254625+00:00 · Tier 1
- [4]Options volume and put/call ratios / Volumes et ratios put/call — 2026-09-16 — Cboe Global Markets · Accessed 2026-09-17T09:05:33.256600+00:00 · Tier 1
- [5]Daily Treasury par yield curve / Courbe quotidienne des taux au pair — 2026-09-16 — U.S. Treasury · Accessed 2026-09-17T09:05:33.257088+00:00 · Tier 1
- [6]/u/onlyreason4u — personal market view / opinion personnelle — Reddit · r/investing · Accessed 2026-09-17T09:05:33.452410+00:00 · Tier 4
- [7]/u/CrypticSoldier — personal market view / opinion personnelle — Reddit · r/investing · Accessed 2026-09-17T09:05:33.452410+00:00 · Tier 4
- [8]/u/Long_on_AMD — personal market view / opinion personnelle — Reddit · r/AMD_Stock · Accessed 2026-09-17T09:08:55.591865+00:00 · Tier 4
- [9]/u/JWcommander217 — personal market view / opinion personnelle — Reddit · r/AMD_Stock · Accessed 2026-09-17T09:08:55.591865+00:00 · Tier 4
- [10]Frankfurt Stock Exchange / Bourse de Francfort — 2015-11-17 — Ank Kumar / Wikimedia Commons · Accessed 2026-09-17T09:09:06.709545+00:00 · Tier 1
- [11]CC BY-SA 4.0 — image license / licence de la photographie — Creative Commons · Accessed 2026-09-17T09:09:06.964587+00:00 · Tier 1
This content is for informational and educational purposes only and is not financial advice. Options involve risk and are not suitable for every investor. Do your own research before trading.
Read next

Relief spreads, but index options resist the all-clear
The rebound widened as volatility fell, yet index options remained more put-heavy than stock options. For premium sellers, calmer prices do not establish a one-way market.
Stock losses expose a split in Fed-day risk appetite
Equity losses coexist with call-heavy stock options and put-heavy index activity. For option sellers, the split shows why trading volume is not a reliable shortcut to investor conviction.

Retail’s AI conviction splits behind Friday’s rebound
Friday’s rebound sits beside a fresh divide over AI risk in retail discussions. For option sellers, mixed options activity and weaker Monday futures offer no single confidence signal.