
More stock names do not necessarily mean less crowding
$QQQ and $IWM rose on September 4 while equal-weight stocks fell. Weekend investors debate concentrated winners and valuation ahead of the U.S. market holiday.
YieldCove Desk
4 min read
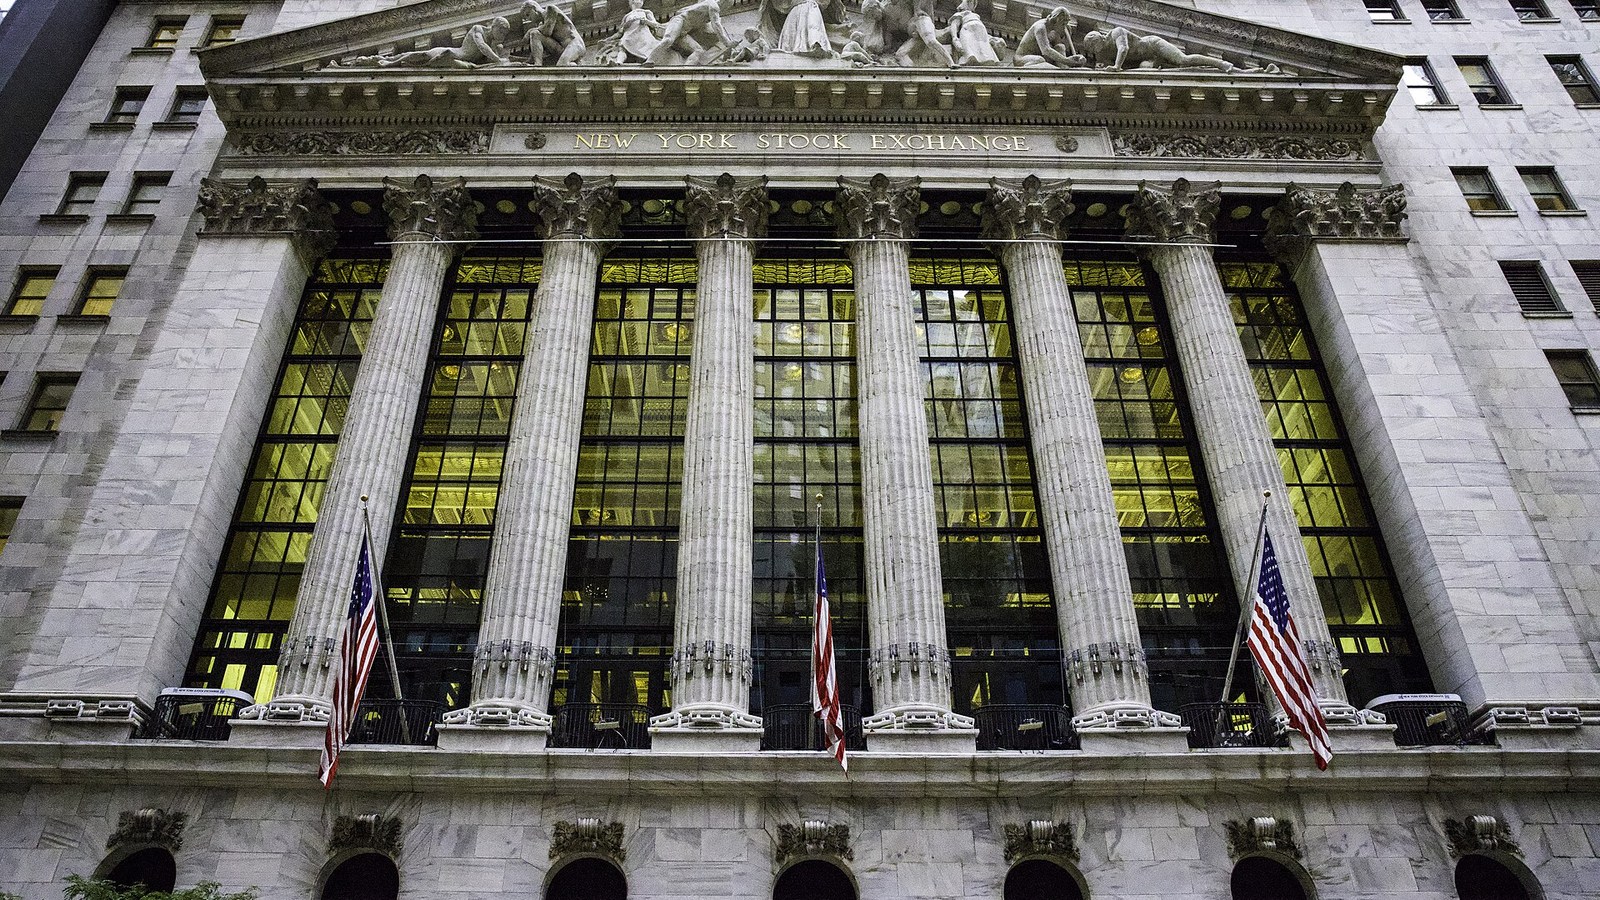
The Sunday question: more names, or less shared risk?
As of 05:10 ET on September 6, 2026, U.S. cash-equity markets are closed. The latest completed session is September 4; the NYSE also closes on September 7 for Labor Day. Weekend discussion is therefore not a new market-price signal. Its useful question is different: does moving money from a familiar winner into another stock genuinely reduce concentration, or merely change the label on a similar risk? The distinction matters when technology strength, uneven equity participation and active index options coexist. [1–4]
YieldCove view
The evidence supports selective risk-taking, not a single bullish or bearish crowd. A debate about trimming one winner is not proof of money leaving stocks; adding another name is not proof of economic diversification.
Scoreboard: the latest completed session
$QQQ · September 4
+0.18%
Nasdaq-100 proxy
$RSP · September 4
−0.48%
Equal-weight equity proxy
$VIX · September 4
14.53
+0.21 points versus September 3
10-year Treasury · September 4
4.78%
Official Treasury yield
| Market proxy | Close (USD) | Session change |
|---|---|---|
| $SPY | 770.19 | −0.39% |
| $QQQ | 718.96 | +0.18% |
| $IWM | 296.01 | +0.28% |
| $DIA | 534.08 | −0.53% |
| $RSP | 219.00 | −0.48% |
| $HYG | 79.16 | −0.06% |
| $LQD | 105.48 | −0.02% |
These are delayed, completed-session observations, not executable quotes. $QQQ and small-cap proxy $IWM advanced while $SPY, $DIA and equal-weight proxy $RSP declined. That pattern does not fit a clean story of either indiscriminate enthusiasm or universal retreat. Equal weighting is a useful comparison with capitalization-weighted equities, but it is not a direct count of advancing stocks. The strongest inference is modest: leadership differed across baskets. Calling the whole market broadly stronger would erase that disagreement. [2–3]
Institutions: exposure is not the same as conviction
Cboe’s September 4 equity put/call ratio was 0.58, while the combined $SPX and $SPXW ratio was 1.15. Calls outweighed puts in the equity category, but puts outweighed calls in that index category. These are contract-volume ratios, not signed flows or a survey of beliefs. A call can be sold against shares; a put can hedge an existing holding. The contrast is consistent with risk-taking alongside protection, without proving which investors initiated either side or why. [4]
The volatility picture is similarly restrained. $VIX closed at 14.53 on September 4, versus 14.32 on September 3, a rise of 0.21 points. A higher reading alongside pockets of equity strength is a reason to avoid equating gains with the disappearance of uncertainty. It is not, by itself, a forecast of a sell-off. The index describes option-implied volatility, not the direction of the next session or the realized outcome for an individual share. [5]
The CFTC’s futures-only positions dated September 1 provide a more direct but older institutional comparison. In E-mini S&P 500 contracts, asset managers were net long 934,180 contracts; leveraged funds were net short 317,564. Opposite signs do not mean one group knows something the other does not. Mandates, cash holdings and offsetting trades can produce very different futures books. These totals describe outstanding positions at a specific date, not new purchases on September 4, and cannot establish that all institutions share a directional view. [6]
Credit and rates: a check on the equity story
On September 4, high-yield bond proxy $HYG slipped 0.06% and investment-grade proxy $LQD slipped 0.02%. Those small price changes do not demonstrate a broad flight from corporate credit. Nor do they prove spreads tightened: bond-fund prices reflect interest rates, credit exposure and fund-specific features. Treasury yields were 4.37% at 2 years and 4.78% at 10 years, leaving a positive 41-basis-point gap. That curve describes financing conditions; it does not identify the intentions of equity buyers. [2–3, 7]
Retail pulse: trimming winners, keeping familiar risks
Fresh weekend discussions in r/stocks place concentration and profit-taking next to continued interest in equities. A discussion about moving part of a $NVDA holding into $AVGO and $MRVL sits alongside a question about taking profits in $MSFT. A $NKE turnaround argument supplies a different kind of optimism. These are individual opinions, not verified company developments or evidence of aggregate buying. The useful observation is the coexistence of discomfort with concentrated winners and willingness to consider another stock, rather than an unqualified rush toward cash. [8]
In r/ValueInvesting, a discussion questions how durable $PLTR’s competitive position must be to support its valuation. That adds a skeptical counterpoint, not a valuation conclusion about the company. The broader analytical distinction is between owning more tickers and owning less shared economic risk. Shifting between businesses exposed to similar spending priorities may reduce single-company dependence while retaining a common vulnerability. Weekend conversation cannot quantify that exposure or establish a representative retail consensus. It can highlight a question that portfolio-level analysis must answer. [9]
Where the signals agree—and where they do not
| Signal | Observed contrast | Interpretation and limit |
|---|---|---|
| Equities | $QQQ +0.18%; $RSP −0.48% | Selective leadership, not uniformly stronger breadth. |
| Options | Equity put/call 0.58; $SPX + $SPXW 1.15 | Call activity coexists with index puts; motives unknown. |
| Institutional positions | Asset managers net long; leveraged funds net short | Different exposures, not a unified institutional vote. |
| Retail discussion | Trimming winners versus turnaround interest | Risk is being debated; aggregate flows are not established. |
What could change this view
A more convincing improvement would combine broader equity participation with steadier corporate credit and less expensive index protection. A weaker picture would combine narrowing leadership with deteriorating credit prices and rising volatility. Neither condition follows automatically from a single session. New company disclosures or a material change in rate expectations could alter the comparison when cash trading resumes. The question is whether several independent market indicators begin telling the same story—not whether one popular name or one forceful opinion dominates attention.
Counterargument and bottom line
The strongest counterargument is that mixed signals are ordinary. A holiday-adjacent session and separate investor mandates can produce divergence without an important turning point. Modest bond-fund moves and a small volatility increase do not justify a crisis narrative. Conversely, technology resilience does not make concentration harmless. YieldCove’s interpretation remains conditional: this is a market in which the location of risk deserves more attention than a blanket bullish-or-bearish label. More stock names can change a portfolio’s appearance without resolving its underlying vulnerability. That is an educational distinction, not a recommendation to trade.
Sources
- [1]2026 market holidays / Jours de fermeture en 2026 — NYSE · Accessed 2026-09-06T09:06:22.529112+00:00 · Tier 1
- [2]September 4 ETF closes / Clôtures des FNB du 4 septembre — CNBC · Accessed 2026-09-06T09:06:22.451467+00:00 · Tier 2
- [3]Completed-session market prices / Prix de la séance terminée — TradingView · Accessed 2026-09-06T09:06:22.274344+00:00 · Tier 3
- [4]September 4 options statistics / Statistiques des options du 4 septembre — Cboe Global Markets · Accessed 2026-09-06T09:06:22.482584+00:00 · Tier 1
- [5]$VIX daily history / Historique quotidien du $VIX — Cboe Global Markets · Accessed 2026-09-06T09:06:22.479083+00:00 · Tier 1
- [6]September 1 futures-only positions / Positions à terme au 1er septembre — Commodity Futures Trading Commission · Accessed 2026-09-06T09:08:25.099879+00:00 · Tier 1
- [7]2026 Treasury yields / Rendements du Trésor en 2026 — U.S. Department of the Treasury · Accessed 2026-09-06T09:06:22.499476+00:00 · Tier 1
- [8]Investor discussion / Discussions boursières — Reddit · r/stocks · Accessed 2026-09-06T09:06:22.541676+00:00 · Tier 4
- [9]Valuation discussion / Discussions sur la valorisation — Reddit · r/ValueInvesting · Accessed 2026-09-06T09:08:25.100411+00:00 · Tier 4
- [10]New York Stock Exchange photograph / Photographie de la Bourse de New York — Billie Grace Ward · Wikimedia Commons · Accessed 2026-09-06T09:10:03.973211+00:00 · Tier 1
This content is for informational and educational purposes only and is not financial advice. Options involve risk and are not suitable for every investor. Do your own research before trading.
Read next

Relief spreads, but index options resist the all-clear
The rebound widened as volatility fell, yet index options remained more put-heavy than stock options. For premium sellers, calmer prices do not establish a one-way market.

Cheaper oil lifts futures, but Japan adds another rate hurdle
Falling oil and stronger equity futures extend the relief rally even as Japan tightens monetary policy. For premium sellers, calmer broad-market volatility must still be weighed against elevated bond yields and company-specific risks.
Stock losses expose a split in Fed-day risk appetite
Equity losses coexist with call-heavy stock options and put-heavy index activity. For option sellers, the split shows why trading volume is not a reliable shortcut to investor conviction.