Key takeaways
- Vistra rose 10.52% in a dated November 6 near-close snapshot after reporting stronger power profits.
- The company raised its 2026 outlook, introduced 2027 guidance and added USD 1.5 billion to buyback authorization.
- Lower implied volatility does not remove outage, acquisition or put-assignment risk.
VST, Nov. 6 at 15:59:59 EST
USD 124.77
+USD 11.88 / +10.52% versus prior close
Reported near-close volume
10,946,102 shares
1.55× preceding 20 full-session mean
Cboe 30-day implied volatility
53.73%
15-minute delayed snapshot; IV rank unverified
Q3 ongoing adjusted EBITDA
USD 2.378 billion
+50.41% year over year; non-GAAP
2027 ongoing adjusted EBITDA guidance
USD 7.7bn–8.5bn
Initial forecast issued November 6
Next earnings date
Unconfirmed
No future issuer results date verified
A profit jump, not just an AI-power headline
Vistra’s November 6 results gave investors concrete numbers behind the power-demand story. Yahoo’s 15:59:59 EST snapshot put VST at USD 124.765, displayed as USD 124.77, versus USD 112.89 the previous session: up USD 11.875, or 10.52%. This is a dated near-close observation, not a certified final closing price. Market snapshot
Reported volume reached 10,946,102 shares, 1.55 times the 7,070,335-share average of the preceding 20 completed sessions, October 9–November 5. The near-close snapshot and full-day historical average have different observation windows. That activity shows substantial turnover, but does not identify why each investor traded. Volume history
For the quarter ended September 30, operating revenue rose 27.68% to USD 6.347 billion from USD 4.971 billion. GAAP net income increased to USD 1.140 billion from USD 652 million, but included USD 559 million of unrealized gains on hedges expected to settle in future years. Those accounting gains are not equivalent to cash already collected. Issuer results
What drove the improvement
Ongoing Operations Adjusted EBITDA reached USD 2.378 billion, up 50.41% from USD 1.581 billion. EBITDA is a profit measure before interest, taxes, depreciation and amortization; Vistra makes additional adjustments and excludes its Asset Closure segment. The company attributes the increase mainly to higher realized energy and capacity prices, a full quarter from the Lotus plants and Martin Lake Unit 1 returning to operation.
| Measure | 2026 / reported | 2027 forecast |
|---|---|---|
| Q3 operating revenue | 6.347 | Not applicable |
| Q3 GAAP net income | 1.140 | Not applicable |
| Q3 adjusted EBITDA | 2.378 | Not applicable |
| Full-year adjusted EBITDA guidance | 7.1–7.5 | 7.7–8.5 |
| Full-year adjusted FCFbG guidance | 4.3–4.7 | 4.3–5.1 |
| Additional buyback authorization | 1.5 | No promised execution date |
The release also confirms October’s Cogentrix acquisition added approximately 5,500 megawatts of gas generation. Vistra’s presentation says the 2027 outlook reflects Cogentrix and the first phase of its Meta operating power-purchase agreement. This is an earnings contribution forecast, not a new Meta deal announced today. Official presentation
Vistra raised the midpoint and narrowed its 2026 EBITDA range to USD 7.1 billion–7.5 billion, then introduced USD 7.7 billion–8.5 billion for 2027. The midpoints, USD 7.3 billion and USD 8.1 billion, imply 10.96% growth if achieved. Its adjusted free cash flow before growth, or FCFbG, also excludes items such as working-capital changes and growth investment, so it is not unrestricted cash after every spending need.
Our disciplined approach to spring maintenance paid off when our customers and communities needed reliable power most.
Peers rallied too
Constellation Energy and NRG also advanced in nearby end-of-session observations, as the chart shows. Their gains supply sector context, not proof of a single common catalyst. The broader backdrop included October U.S. payroll growth of 165,000 and 4.1% unemployment, released November 6; neither figure isolates Vistra’s share-price response. BLS employment report
Power producers: November 6 near-close gains
Versus November 5 close: VST 15:59:59, CEG 16:00:01 and NRG 15:59:58 EST. Dated observations, not synchronized or certified final closes.
Source: Yahoo Finance chart snapshots retrieved November 6, 2026 at 16:09:38 EST; returns recalculated from original USD prices.
What it means for option sellers
Cboe’s snapshot retrieved at 16:09:39 EST showed 30-day implied volatility of 53.73%, down approximately 6.00 percentage points from its comparison level. Quotes were about 15:54 EST, 15-minute delayed at writing; check live prices before trading. IV rank was not verified, and this underlying-level IV is not a quote for any particular contract. Cboe delayed data
All else equal, falling implied volatility lowers option values, which can help an existing short option but reduces premium available on a new sale. Stock movement, time and spreads still matter. For the wheel, a cash-secured put can require buying shares on assignment; a covered call can require selling the shares and caps upside. Vega; Put mechanics; Covered calls
Educational math, not a market quote
A hypothetical November 20 USD 115 put sold for an invented USD 2.00 per share would collect USD 200 on a standard 100-share contract and require USD 11,500 gross cash collateral. Breakeven would be USD 113; loss at a zero stock price would be USD 11,300 before fees. A hypothetical USD 135 covered call illustrates capped upside. These are not executable quotes, verified returns or recommendations.
Earnings passed; business risk remains
The November 6 report is out, but the next earnings date remains unconfirmed. A large premium does not insure against plant outages, weaker power prices, acquisition integration costs or a gap below a put strike.
What to watch next
- November 10, 08:30 EST: October CPI is scheduled; inflation can reset the broader rates backdrop. Official CPI schedule
- November 20: the illustrative expiry is not a signal to trade. The earnings calendar and actual contract liquidity still need checking.
- Year-end 2026: compare delivery with the revised annual outlook. By year-end 2028, Vistra expects to complete its approximately USD 2.5 billion remaining buyback authorization; authorization is not a purchase already made.
- Main risks: outages, commodity-price changes, acquisition execution and accounting-versus-cash differences can undermine the apparent improvement.
- A general review plan checks fresh issuer notices, spreads and assignment cash before any option sale; a rally alone does not establish an acceptable entry.
- If the operating outlook deteriorates, reassess share ownership rather than assuming another option premium repairs the thesis.
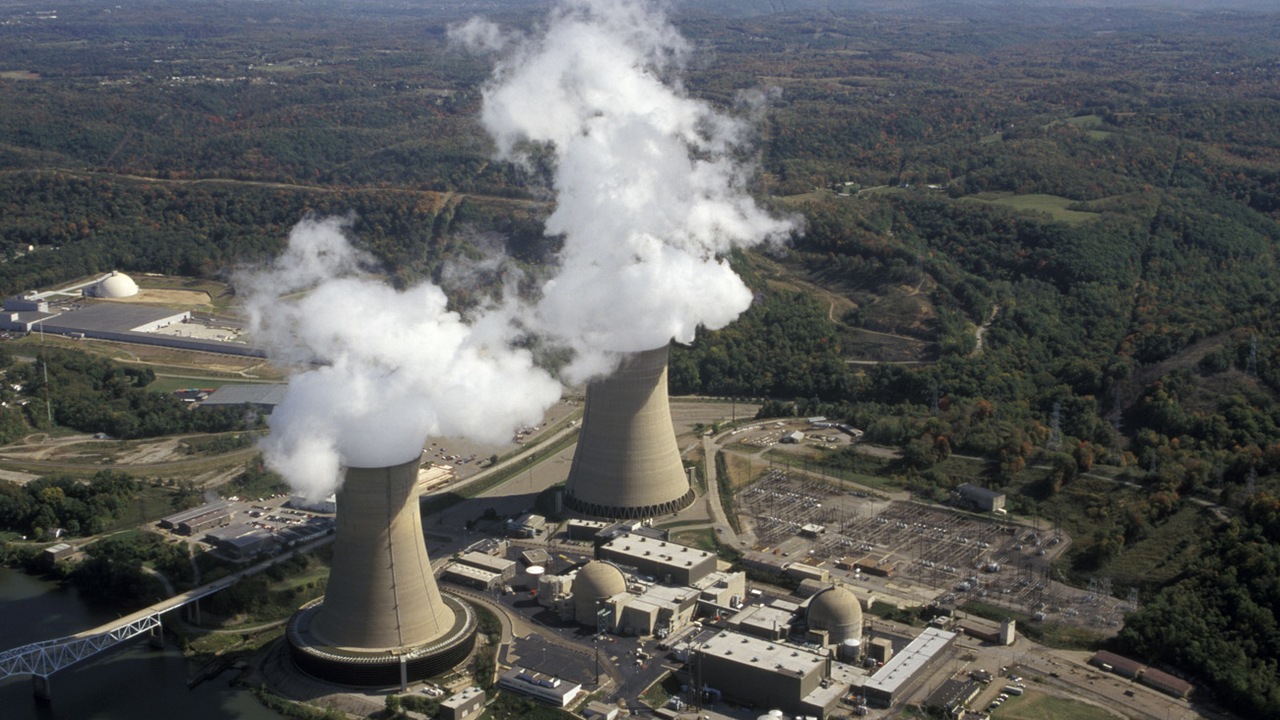
The hero is an archival Beaver Valley aerial, not a photograph of today’s operations. The NRC image is U.S. public domain, cropped and resized. Photo provenance; Use basis
Sources
- [1]Vistra: third-quarter 2026 results and outlook — Vistra · Accessed 2026-11-06T16:09:38.516901-05:00 · Tier 1
- [2]Third Quarter 2026 Results presentation — Vistra · Accessed 2026-11-06T16:09:41.042787-05:00 · Tier 1
- [3]VST near-close price and volume snapshot — Yahoo Finance · Accessed 2026-11-06T16:09:38.789881-05:00 · Tier 2
- [4]VST daily history, 20 prior sessions used for volume baseline — Yahoo Finance · Accessed 2026-11-06T16:09:38.577947-05:00 · Tier 2
- [5]CEG near-close market snapshot — Yahoo Finance · Accessed 2026-11-06T16:09:38.822312-05:00 · Tier 2
- [6]NRG near-close market snapshot — Yahoo Finance · Accessed 2026-11-06T16:09:38.864324-05:00 · Tier 2
- [7]October 2026 Employment Situation, released November 6 — U.S. Bureau of Labor Statistics · Accessed 2026-11-06T21:12:12.528395+00:00 · Tier 1
- [8]VST delayed options snapshot and 30-day implied volatility — Cboe · Accessed 2026-11-06T16:09:39.544251-05:00 · Tier 1
- [9]Vega: option sensitivity to implied volatility — Options Industry Council · Accessed 2026-11-06T16:09:38.519790-05:00 · Tier 1
- [10]Cash-secured put: mechanics and risk — Options Industry Council · Accessed 2026-11-06T16:09:38.578376-05:00 · Tier 1
- [11]Covered call: mechanics and risk — Options Industry Council · Accessed 2026-11-06T16:09:38.578754-05:00 · Tier 1
- [12]Consumer Price Index official release schedule — U.S. Bureau of Labor Statistics · Accessed 2026-11-06 · Tier 1
- [13]Beaver Valley Nuclear Power Plant photograph: NRC provenance — Wikimedia Commons / U.S. NRC · Accessed 2026-11-06T16:09:39.534935-05:00 · Tier 1
- [14]PD-USGov-NRC public-domain use basis — Wikimedia Commons · Accessed 2026-11-06T16:09:39.534783-05:00 · Tier 1
This content is for informational and educational purposes only and is not financial advice. Options involve risk and are not suitable for every investor. Do your own research before trading.
Keep YieldCove close
Choose YieldCove as a preferred source for Top Stories in Google Search.
Run the numbers before you trade: the free wheel strategy calculator sizes the whole cycle, and the cash-secured put calculator shows the cash, return and breakeven of one put.