Key takeaways
- DraftKings fell 27.72% in the dated November 6 morning snapshot.
- Revenue grew 16%, but customer acquisition and Predictions spending weighed on profit.
- The 2027 outlook assumes stronger revenue and less Predictions investment; those are forecasts, not guarantees.
DKNG, Nov. 6 at 11:24:43 EST
USD 17.00
−USD 6.52 / −27.72% vs prior close
Partial-session share volume
28,665,686
2.33× prior 20 full-session mean
Q3 2026 revenue
USD 1.329 billion
+16% year over year
2026 adjusted EBITDA outlook
USD 175m–275m
Non-GAAP, full-year forecast
Contract IV / IV rank
Unconfirmed
No verified contract-level snapshot
Next earnings date
Unconfirmed
Q3 results released Nov. 5
What happened: growth meets a bigger bill
DraftKings’ November 5 results put growth and profitability on different tracks. Third-quarter revenue reached USD 1.329 billion, up 16% from a year earlier, while the GAAP net loss widened to USD 468.720 million from USD 256.788 million. The loss was USD 0.94 per share; the separate adjusted loss was USD 0.53 per share. Adjusted figures exclude specified expenses and are not interchangeable with GAAP profit. Issuer results
At 11:24:43 EST on November 6, Yahoo’s snapshot showed USD 17.00, down USD 6.52, or 27.72%, from USD 23.52. Volume was 28,665,686 shares, already 2.33 times the 12,300,080-share average of the preceding 20 completed sessions, October 9–November 5. That compares a partial day with full days, not identical trading intervals; these are dated observations, not live quotes. Market snapshot
Why the spending matters
Customer demand was not absent: monthly unique payers rose about 13% to 4.1 million and average revenue per payer increased about 3% to USD 109. But sales and marketing expense reached USD 605.664 million, versus USD 360.370 million a year earlier. The financial question is whether acquired customers eventually generate enough revenue to justify that cost, rather than simply whether the customer count grows.
- Core demand: management cited healthy engagement and a higher Sportsbook net revenue margin.
- Near-term pressure: customer promotions are expected to offset most 2026 Predictions gross revenue.
- Execution test: higher spending today only creates value if customer economics improve later.
| Full-year measure | 2026 outlook | 2027 outlook |
|---|---|---|
| Total revenue | 6.35–6.55 billion | 7.35–7.75 billion |
| Total adjusted EBITDA | 175–275 million | 800–1,000 million |
| Core adjusted EBITDA | 875–925 million | 1,150–1,250 million |
| Predictions revenue | Immaterial | 650–750 million |
| Predictions adjusted EBITDA investment | 650–700 million | 250–350 million |
The 2027 bridge is the heart of the story. At the midpoints, USD 1.2 billion of core adjusted EBITDA minus USD 300 million of Predictions investment produces USD 900 million of total adjusted EBITDA. This is a useful way to understand management’s assumptions, not evidence that the recovery has happened. Predictions revenue is forecast to become meaningful next year, while the investment burden falls.
Growth is visible; the return on today’s customer-acquisition bill is still a forecast.
Peers show pressure, not an identical business
FanDuel owner Flutter reported on November 4 that group revenue rose 2% to USD 3.874 billion, while adjusted EBITDA fell 25% to USD 360 million. Near 11:24 EST on November 6, FLUT was down 5.83% and MGM 1.54%, versus DKNG’s 27.72% decline. Those nearby snapshots suggest broader gaming pressure alongside a much larger DraftKings-specific repricing; they do not prove a single cause or make these businesses identical. Flutter presentation
Gaming shares: November 6 morning declines
Change from November 5 close. Separate nearby snapshots: DKNG 11:24:43, FLUT 11:24:39, MGM 11:24:25 EST; not closing returns.
Source: Yahoo Finance chart snapshots, retrieved Nov. 6, 2026 at 11:24:45 EST; USD prices versus Nov. 5 close. Returns recalculated from original prices.
What it means for option sellers
A lower share price does not automatically make a cash-secured put safer. Assignment still means buying at the strike, even if the stock falls much further; a covered call caps upside while leaving substantial share-price downside. For the wheel, the business-quality question comes before the premium: would the ownership obligation still make sense under a weaker earnings path? OIC put guide / covered-call guide
A current contract IV and comparable IV rank were not established, so neither is supplied. Implied volatility can fall after uncertainty clears, reducing option value, but stock losses can outweigh that benefit for a put seller. The November 5 earnings release is behind us; the next company earnings date remains unconfirmed in the checked sources. No option bid, ask, delta or probability is claimed here. OIC volatility explanation
Worked example — hypothetical, not an offer
An illustrative November 20 put at a USD 15 strike with a made-up USD 0.50 premium per share means USD 1,500 of strike cash and USD 50 gross premium for one standard 100-share contract. Expiration breakeven is USD 14.50; loss at zero is USD 1,450 before fees. A hypothetical USD 20 covered call would commit the covered shares to sale at USD 20 if assigned. Neither strike is a recommendation or a verified market quote.
The premium does not absorb an earnings reset
Regulatory changes, customer promotions and disappointing 2027 execution could change the valuation again. A short option can become more expensive to close during another decline. Check live prices and contract terms; a large stock drop is not proof of a bargain.
- Risk: forecasts depend on customer economics and evolving prediction-market rules.
- Review: compare actual bid/ask spreads and contract liquidity before evaluating any premium.
- Management: closing or rolling may realize a loss; rolling does not erase it.
- Assignment: a sold put requires purchase; an assigned covered call requires delivery of the covered shares.
What to watch next
- November 10, 08:30 ET: October CPI; November 13, 08:30 ET: October PPI. Both precede the hypothetical November 20 expiry.
- Through the fourth quarter, ending December 31: whether Predictions spending stays within its USD 175m–225m adjusted EBITDA investment outlook.
- 2027: whether Predictions revenue reaches the USD 650m–750m forecast. The next earnings date is unconfirmed, not assumed.
The wider consumer backdrop is not uniformly weak: November 6 payroll data showed 165,000 additional U.S. jobs in October and 4.1% unemployment. That provides context for discretionary spending, not proof of future betting demand. The immediate task is separating reported growth, forecast economics and the obligation embedded in an option. BLS employment release / release calendar
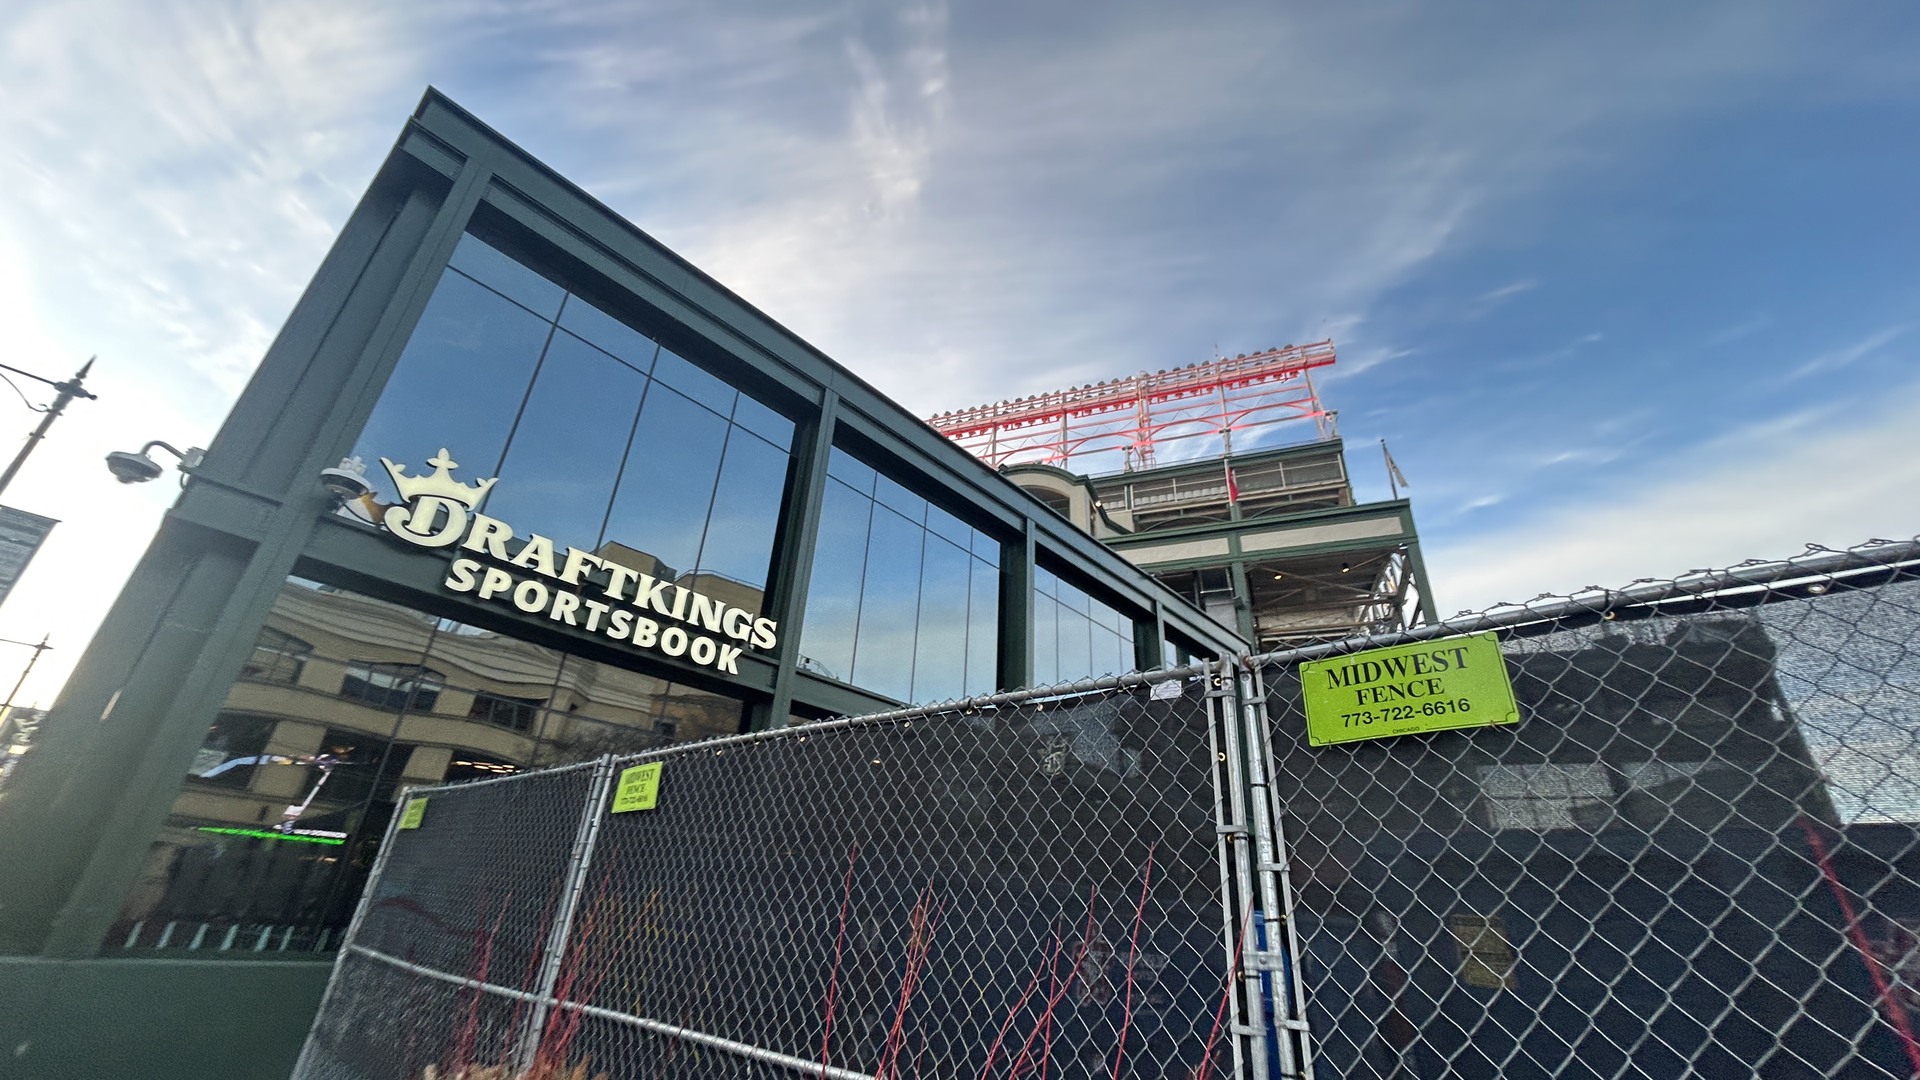
Photo: archival January 4, 2025, DraftKings Sportsbook at Wrigley Field, Chicago. The SecretName101 photograph is CC BY 4.0, cropped and resized; no endorsement is implied.
Risk note: general information, not personal financial advice. Options can cause substantial losses; illustrative figures exclude fees, taxes and execution effects.
Sources
- [1]Q3 2026 results and 2026/2027 guidance — DraftKings · Accessed 2026-11-06T11:24:45.197335-05:00 · Tier 1
- [2]Q3 2026 supplemental results, November 4 — Flutter Entertainment · Accessed 2026-11-06T11:27:17.943864-05:00 · Tier 1
- [3]DKNG November 6 11:24:43 EST market snapshot — Yahoo Finance · Accessed 2026-11-06T11:24:45.482234-05:00 · Tier 2
- [4]DKNG preceding daily prices and volume, 3-month series — Yahoo Finance · Accessed 2026-11-06T11:24:45.453016-05:00 · Tier 2
- [5]FLUT November 6 11:24:39 EST snapshot — Yahoo Finance · Accessed 2026-11-06T11:24:45.546017-05:00 · Tier 2
- [6]MGM November 6 11:24:25 EST snapshot — Yahoo Finance · Accessed 2026-11-06T11:24:45.484810-05:00 · Tier 2
- [7]October 2026 employment report, November 6 — U.S. Bureau of Labor Statistics · Accessed 2026-11-06T11:27:17.920249-05:00 · Tier 1
- [8]November 2026 release calendar — U.S. Bureau of Labor Statistics · Accessed 2026-11-06T11:27:17.960509-05:00 · Tier 1
- [9]Cash-secured put mechanics and risks — Options Industry Council · Accessed 2026-11-06T11:24:45.222911-05:00 · Tier 1
- [10]Covered-call mechanics and risks — Options Industry Council · Accessed 2026-11-06T11:24:45.225665-05:00 · Tier 1
- [11]Vega and implied-volatility sensitivity — Options Industry Council · Accessed 2026-11-06T11:26:02.295980-05:00 · Tier 1
- [12]DraftKings Sportsbook, archival January 4, 2025 photo — SecretName101 / Wikimedia Commons · Accessed 2026-11-06T11:16:31.040186-05:00 · Tier 1
- [13]Creative Commons Attribution 4.0 licence — Creative Commons · Accessed 2026-11-06T11:16:31.133968-05:00 · Tier 1
This content is for informational and educational purposes only and is not financial advice. Options involve risk and are not suitable for every investor. Do your own research before trading.
Keep YieldCove close
Choose YieldCove as a preferred source for Top Stories in Google Search.
Run the numbers before you trade: the free wheel strategy calculator sizes the whole cycle, and the cash-secured put calculator shows the cash, return and breakeven of one put.