
Key takeaways
- CVS plans to separate its pharmacies from its insurance and pharmacy-services group. Completion is targeted for the first half of 2028, not today. [1]
- Q3 revenue rose 5.4%; adjusted EPS reached US$2.09 and the 2026 outlook improved. [2]
- The stock still fell sharply in the captured delayed session. Lower implied volatility does not remove assignment risk. [3]
Delayed CVS stock
US$81.29
−11.07%
Captured volume / prior 20-day mean
1.35×
Q3 revenue
US$108.399bn
+5.4% YoY
2026 adjusted EPS outlook
At least US$8.20
Cboe 30-day IV
32.12%
−9.23 percentage points
A breakup plan lands alongside stronger earnings
CVS Health announced on November 4 that it intends to create two publicly traded companies. Aetna, CVS Caremark, CVS Specialty, Oak Street Health and Signify Health would remain together under the interim CVS Health name. Approximately 9,000 pharmacies, mail pharmacy, MinuteClinic and Health100 would form CVS Pharmacy. These are proposed business boundaries, not an already completed transaction. [1]
The target is the first half of 2028. Shareholders would own both companies; the separation is intended to be tax-free for U.S. federal income-tax purposes, subject to conditions including final board approval and an effective Form 10 registration statement. Management’s argument is simpler structures and more focused capital allocation. That is an intended benefit, not a guaranteed valuation uplift. [1]
The earnings release covers the quarter ended September 30, 2026. Revenue was US$108.399 billion, versus US$102.871 billion a year earlier. GAAP diluted EPS was US$1.68, compared with a US$3.13 loss; adjusted EPS was US$2.09 versus US$1.60. Last year included a US$5.7 billion goodwill impairment, so the GAAP rebound is not all underlying growth. [2]
The market reaction is not an earnings-only verdict
Cboe’s saved delayed snapshot, retrieved at 11:08:37 ET, showed CVS at US$81.2925 against a US$91.41 previous close: down US$10.1175, or 11.07%. Its last stock trade was stamped 10:42:50 ET. Captured volume was 11,683,811 shares—1.35 times the preceding 20 completed sessions’ full-day average of 8,674,975. This is not a same-time volume comparison or a live quote. [3][7]
Peers did not show one uniform healthcare sell-off. Separate delayed Cboe observations showed UnitedHealth down 0.31% at 10:51:56 ET, Cigna up 2.66% at 10:50:32 and healthcare ETF XLV up 1.52% at 10:41:40. Those unsynchronized observations provide context, not proof that the separation caused every dollar of CVS’s decline. The restructuring adds execution questions to otherwise improving earnings. [1][3–6]
CVS: 40 completed sessions before the announcement
Completed sessions only; the November 4 intraday drop is NOT plotted. No forecast.
Source: Yahoo Finance unadjusted daily closes, September 9–November 3, 2026; retrieved November 4 at 11:08:37 ET. [7]
Where the operating improvement came from
Health Care Benefits adjusted operating income rose to US$912 million from US$314 million. Its medical benefit ratio fell to 91.3% from 92.8%, reflecting improved Government-business performance. Health Services adjusted operating income increased 2.7% to US$2.106 billion; Pharmacy & Consumer Wellness rose 10.6% to US$1.635 billion despite revenue declining 2.0%. Better profits do not mean every business is growing sales. [2]
| Measure | New result / outlook | Comparison |
|---|---|---|
| Q3 total revenue | US$108.399bn | US$102.871bn a year earlier |
| Q3 adjusted EPS | US$2.09 | US$1.60 a year earlier |
| 2026 adjusted EPS | At least US$8.20 | Previous US$7.90–8.10 |
| 2026 GAAP diluted EPS | At least US$6.98 | Previous US$6.84–7.04 |
| 2026 operating cash flow | At least US$15.5bn | Previous at least US$11.5bn |
| Year-to-date operating cash flow | US$15.3bn | Nine months ended Sept. 30 |
The higher annual cash-flow floor matters, but it is guidance, not cash already guaranteed for the final quarter. CVS still cited elevated cost trends and potential macroeconomic headwinds. Meanwhile, the proposed pharmacy company must stand on its own economics, and the remaining group retains insurance and pharmacy-services exposure. A cleaner organization chart cannot by itself settle those risks. [1][2]
What it means for option sellers
Cboe displayed 30-day implied volatility of 32.124%, down 9.233 percentage points. A separate OptionCharts page captured at 11:10 ET displayed 32.95% IV and 42.19% IV rank, with options marked 15-minute delayed. The vendors and observation times differ; IV rank is not a probability of profit. These snapshots do not justify calling premiums unusually rich. [3][8]
For the wheel, the central question is the obligation behind the credit. A cash-secured put can become shares during a sharp decline; a later covered call limits upside without eliminating stock downside. Today’s scheduled earnings release is already out, but restructuring announcements and the next report can still reprice risk. The issuer calendar showed no upcoming event date, so no next-earnings date is certified here. [1][10–12]
Illustration, not a trade recommendation
The saved November 20 US$75 put showed a US$0.42 bid and US$0.54 ask. Assuming one standard 100-share contract sold at that bid: US$42 gross credit, US$7,500 cash reserved and US$74.58 breakeven. At US$70 on expiry, gross loss would be US$458; at zero, US$7,458. Fees reduce returns; tax treatment depends on individual circumstances. The US$90 call is a separate educational covered-call strike, not a recovery promise. [3][10][11]
A smaller option price is not a smaller stock obligation
Quotes were 15-minute delayed at the time of writing. Check live prices before trading. The example is a dated observation, not an executable order; losses can greatly exceed the premium. A proposed 2028 separation does not remove today’s stock risk. [1][3][10]
- Reassess the underlying business before treating a lower share price as a bargain; assignment changes the exposure, not the business risks. [1][10]
- A management plan should distinguish closing risk, accepting assignment and considering a later covered call. None guarantees a loss recovery. [10][11]
Stronger earnings and a simpler future structure do not make the present stock obligation simpler.
What to watch next
- November 6, 08:30 ET: October U.S. employment report; November 10, 08:30 ET: October CPI. Both can shift the wider market before the illustrative November 20 expiry. [9]
- First half of 2028: management’s conditional separation target. Watch for the Form 10, capital structures and further company disclosures; no exact completion day is promised. [1]
- Next CVS earnings: unconfirmed on the checked issuer calendar. Recheck company dates before selecting an expiry or rolling exposure. [12]
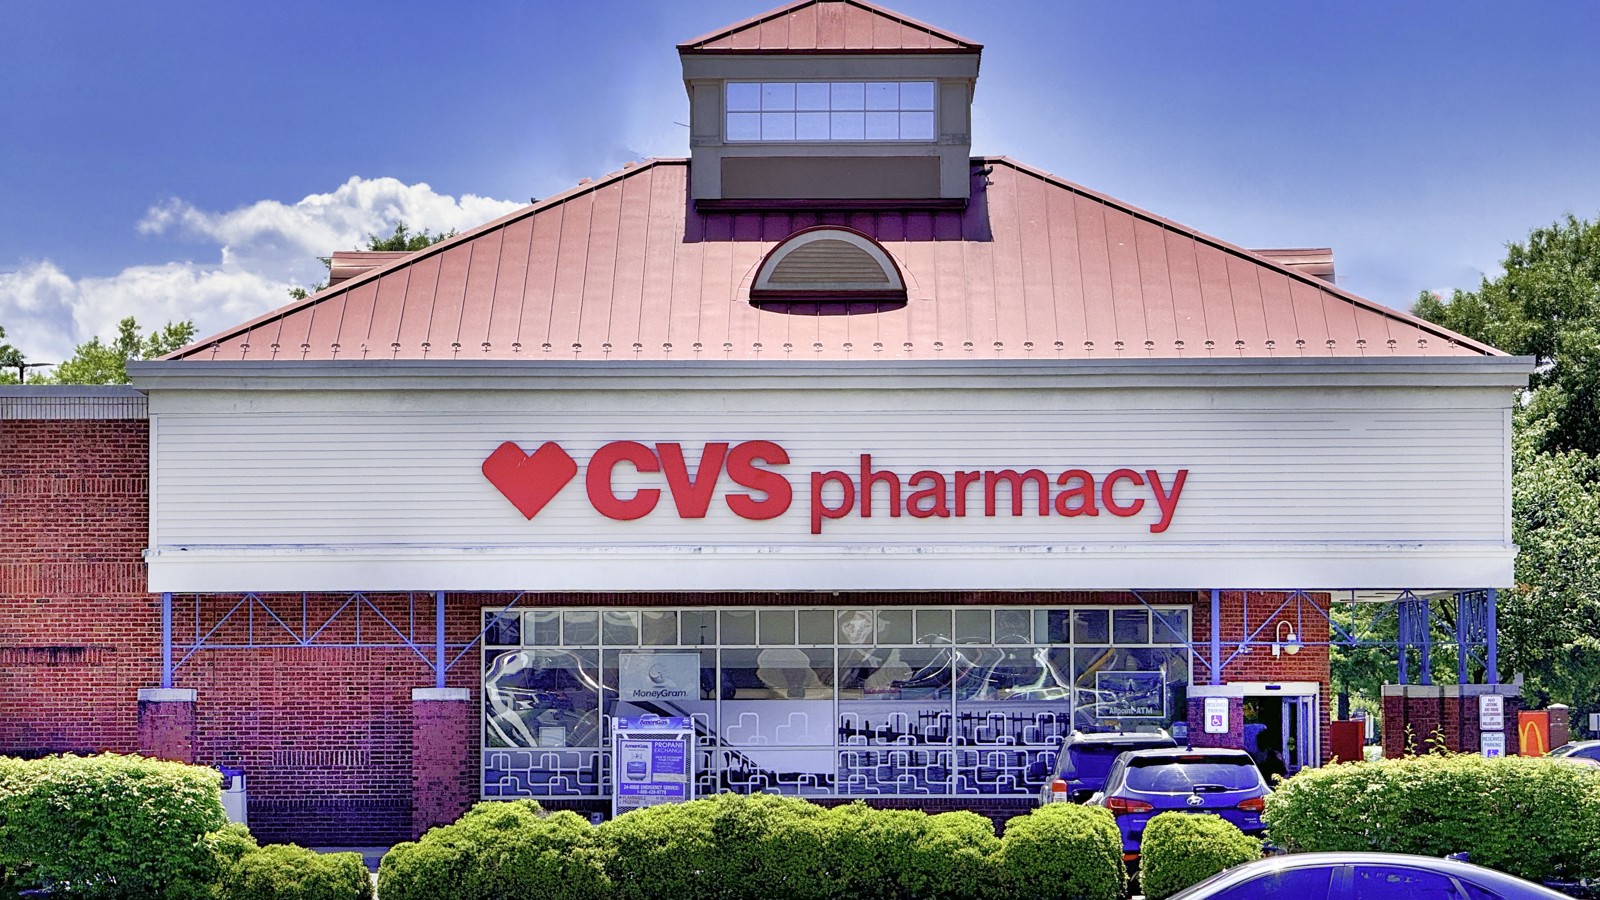
Hero: archival May 29, 2024 CVS storefront in Solomons, Maryland, photographed by Harrison Keely, CC BY 4.0. Cropped and resized; not today’s news scene. No endorsement implied. [13][14]
For information and education, not personal financial advice. Options and shares can lose substantial value; examples exclude fees, taxes and slippage.
Sources
- [1]Separation plan — CVS Health · Accessed 2026-11-04T11:08:37.218460-05:00 · Tier 1
- [2]Q3 2026 results and outlook — CVS Health · Accessed 2026-11-04T11:08:37.217732-05:00 · Tier 1
- [3]CVS delayed snapshot — Cboe · Accessed 2026-11-04T11:08:37.221863-05:00 · Tier 1
- [4]UNH delayed snapshot — Cboe · Accessed 2026-11-04T11:08:37.576773-05:00 · Tier 1
- [5]CI delayed snapshot — Cboe · Accessed 2026-11-04T11:08:37.710448-05:00 · Tier 1
- [6]XLV delayed snapshot — Cboe · Accessed 2026-11-04T11:08:37.766302-05:00 · Tier 1
- [7]CVS daily history — Yahoo Finance · Accessed 2026-11-04T11:08:37.768278-05:00 · Tier 3
- [8]CVS IV and IV rank — OptionCharts · Accessed 2026-11-04T11:10:06.397338-05:00 · Tier 3
- [9]November release calendar — Bureau of Labor Statistics · Accessed 2026-11-04T11:13:59.485989-05:00 · Tier 1
- [10]Cash-secured put — Options Industry Council · Accessed 2026-11-04T11:08:37.219634-05:00 · Tier 1
- [11]Covered call — Options Industry Council · Accessed 2026-11-04T11:08:37.220092-05:00 · Tier 1
- [12]Issuer event calendar — CVS Health · Accessed 2026-11-04T11:10:54.080749-05:00 · Tier 1
- [13]Solomons archival photograph — Harrison Keely / Wikimedia Commons · Accessed 2026-11-04T11:12:59.537671-05:00 · Tier 1
- [14]CC BY 4.0 licence — Creative Commons · Accessed 2026-11-04T11:12:59.904653-05:00 · Tier 1
This content is for informational and educational purposes only and is not financial advice. Options involve risk and are not suitable for every investor. Do your own research before trading.
Keep YieldCove close
Choose YieldCove as a preferred source for Top Stories in Google Search.
Run the numbers before you trade: the free wheel strategy calculator sizes the whole cycle, and the cash-secured put calculator shows the cash, return and breakeven of one put.


