Key takeaways
- U.S. payrolls rose 165,000 in October; earlier months were revised higher.
- Wages rose 0.4% in a month, keeping inflation risk in focus.
- A technology rebound does not remove next week’s inflation-event risk.
October payroll gain
+165,000
BLS, released Nov. 6
QQQ, Nov. 5 close
USD 647.05
−6.49% vs Nov. 4
QQQ Nov. 5 volume
125.58m shares
3.41× Yahoo displayed average
VIX, Nov. 5 close
28.18 points
Not QQQ contract IV
QQQ IV / IV rank
Unconfirmed
No contract-level figure verified
Next issuer earnings
Not applicable: ETF
Constituent earnings still matter
What changed at 8:30 a.m.
The U.S. labor market delivered a firmer October reading on November 6, 2026. Nonfarm payrolls rose 165,000, against a 48,000 average monthly gain over the previous twelve months. August was revised to 186,000 and September to 60,000: together, 84,000 more jobs than previously reported. This is a meaningful improvement in the hiring picture, not proof that every part of the economy is accelerating. BLS release
The detail matters as much as the headline. Unemployment was 4.1%, which the BLS described as little changed. Average hourly earnings increased USD 0.14 to USD 38.00, up 0.4% for the month and 3.1% over a year.
Meanwhile, people working part time for economic reasons increased by 339,000 to about 4.8 million. Stronger payrolls and lingering household strain can coexist.
| Industry | Jobs added | Reading |
|---|---|---|
| Professional and business services | 70,000 | Largest of these gains |
| Health care | 42,000 | Continued hiring |
| Transportation and warehousing | 25,000 | Delivery and aviation gains |
| Manufacturing | 19,000 | Positive, not economy-wide proof |
Why stocks get a mixed signal
Better hiring can support consumer demand and company sales. But resilient activity and faster monthly wages also leave less reason to assume interest rates will fall quickly. On October 28, the Federal Reserve held its target range at 3.75%–4.00% and said inflation remained elevated. Today’s report adds information to that debate; it does not announce a rate change or settle the December decision. Fed statement
Inflation remains elevated.
The market backdrop is uneven. At 09:12:19 EST on November 6, Yahoo showed QQQ at USD 657.55 in premarket trading, up USD 10.50, or 1.62%, from its USD 647.05 November 5 close. That is a dated snapshot, not a live dealing quote.
Thursday’s USD 44.90 decline was 6.49%, versus losses of 4.41% for broad-market SPY and 4.59% for small-cap IWM. Those declines preceded today’s jobs release; payrolls did not cause yesterday’s selloff. QQQ snapshot
QQQ’s November 5 volume reached 125,582,100 shares, about 3.41 times Yahoo’s displayed average of 36,867,750. This compares a completed session with the provider’s displayed daily average, not today’s partial volume. The larger Nasdaq-fund decline than its peers is a useful concentration warning: one technology-heavy basket can behave very differently from the broad market. SPY / IWM
Before the jobs report: Thursday’s ETF losses
November 5, 2026 close versus November 4. These are prior-session returns, not reactions to the November 6 payroll report.
Source: Yahoo Finance SPY/QQQ/IWM quote pages; Nov. 5 closes vs Nov. 4; retrieved Nov. 6, 2026 at 09:12 EST. Returns recalculated; USD price basis.
What it means for option sellers
Cboe’s VIX closed at 28.18 on November 5, versus 16.61 on November 4, a 69.66% increase. That is a broad S&P 500 volatility gauge, not QQQ’s contract implied volatility or IV rank. Neither a current QQQ contract IV nor a comparable IV rank was independently established for this article, so neither is supplied. A higher VIX alone does not prove a particular put is attractively priced. Cboe daily history
For the wheel, the central question is the obligation behind the premium. A cash-secured put can require buying the underlying at its strike even after a further decline. A covered call brings premium but caps upside and retains most downside exposure.
A rebound therefore creates different risks for a put writer and an existing covered-call writer. Neither strategy becomes safe simply because the employment report looks stronger. OIC put guide / covered-call guide
Worked example — not an option quote
For a purely hypothetical November 20 QQQ put with a USD 620 strike and an illustrative USD 4 premium per share, one standard 100-share contract means USD 62,000 of strike cash, USD 400 gross premium and a USD 616 expiration breakeven. Loss at zero would be USD 61,600 before fees. A hypothetical USD 680 covered call would commit the shares to sale at USD 680 if assigned. These strikes are arithmetic examples, not recommendations or verified market offers.
The next data point can change the price
A November 20 illustration spans both next week’s CPI and PPI releases. Inflation surprises can move the fund and increase the cost of closing a short option. The premium is limited; the downside obligation is not limited to that premium. Check live prices and the actual contract before any decision.
- Risk: stronger payrolls do not cancel the rise in involuntary part-time work.
- Risk: an ETF diversifies company exposure but can remain concentrated in a sector.
- Process: compare the live bid/ask spread, contract IV and assignment cash; a dated stock snapshot cannot establish an executable option price.
- Management: closing or rolling changes exposure and may realize a loss; put assignment is a purchase obligation, not a guaranteed recovery.
What to watch next
- November 10, 08:30 ET: October Consumer Price Index. Wage growth is not itself consumer-price inflation.
- November 13, 08:30 ET: October Producer Price Index, another inflation checkpoint before the hypothetical November 20 expiry.
- December 4, 08:30 ET: November employment report, including possible revisions to October.
- December 9: the decision day of the December 8–9 FOMC meeting. No outcome is assumed here.
QQQ is a fund, so it has no single operating-company earnings date. Its constituents’ results still matter, alongside the macro calendar. The practical takeaway is to separate three things: today’s labor-market news, the fund’s dated price reaction, and the price of the specific option. Confusing them can make a large premium look like easy income when it is compensation for a real obligation. BLS calendar / FOMC calendar
Risk note: this is general information, not personal financial advice. Options can cause substantial losses; hypothetical figures exclude commissions, taxes and execution effects.
Sources
- [1]October 2026 Employment Situation, released November 6 — U.S. Bureau of Labor Statistics · Accessed 2026-11-06T09:13:22.725735-05:00 · Tier 1
- [2]October 28, 2026 policy statement — Federal Reserve · Accessed 2026-11-06T09:12:36.233125-05:00 · Tier 1
- [3]November 2026 release schedule — U.S. Bureau of Labor Statistics · Accessed 2026-11-06T09:13:22.744733-05:00 · Tier 1
- [4]FOMC meeting calendar, 2026 — Federal Reserve · Accessed 2026-11-06T09:12:36.239742-05:00 · Tier 1
- [5]QQQ quote, November 5 close and November 6 09:12:19 EST snapshot — Yahoo Finance · Accessed 2026-11-06T09:12:36.689516-05:00 · Tier 2
- [6]SPY November 5 closing price — Yahoo Finance · Accessed 2026-11-06T09:12:36.585072-05:00 · Tier 2
- [7]IWM November 5 closing price — Yahoo Finance · Accessed 2026-11-06T09:12:36.901812-05:00 · Tier 2
- [8]Daily VIX history through November 5, 2026 — Cboe Global Markets · Accessed 2026-11-06T09:12:36.765794-05:00 · Tier 1
- [9]Cash-secured put: mechanics and risk — Options Industry Council · Accessed 2026-11-06T09:12:36.741040-05:00 · Tier 1
- [10]Covered call: mechanics and risk — Options Industry Council · Accessed 2026-11-06T09:12:36.745091-05:00 · Tier 1
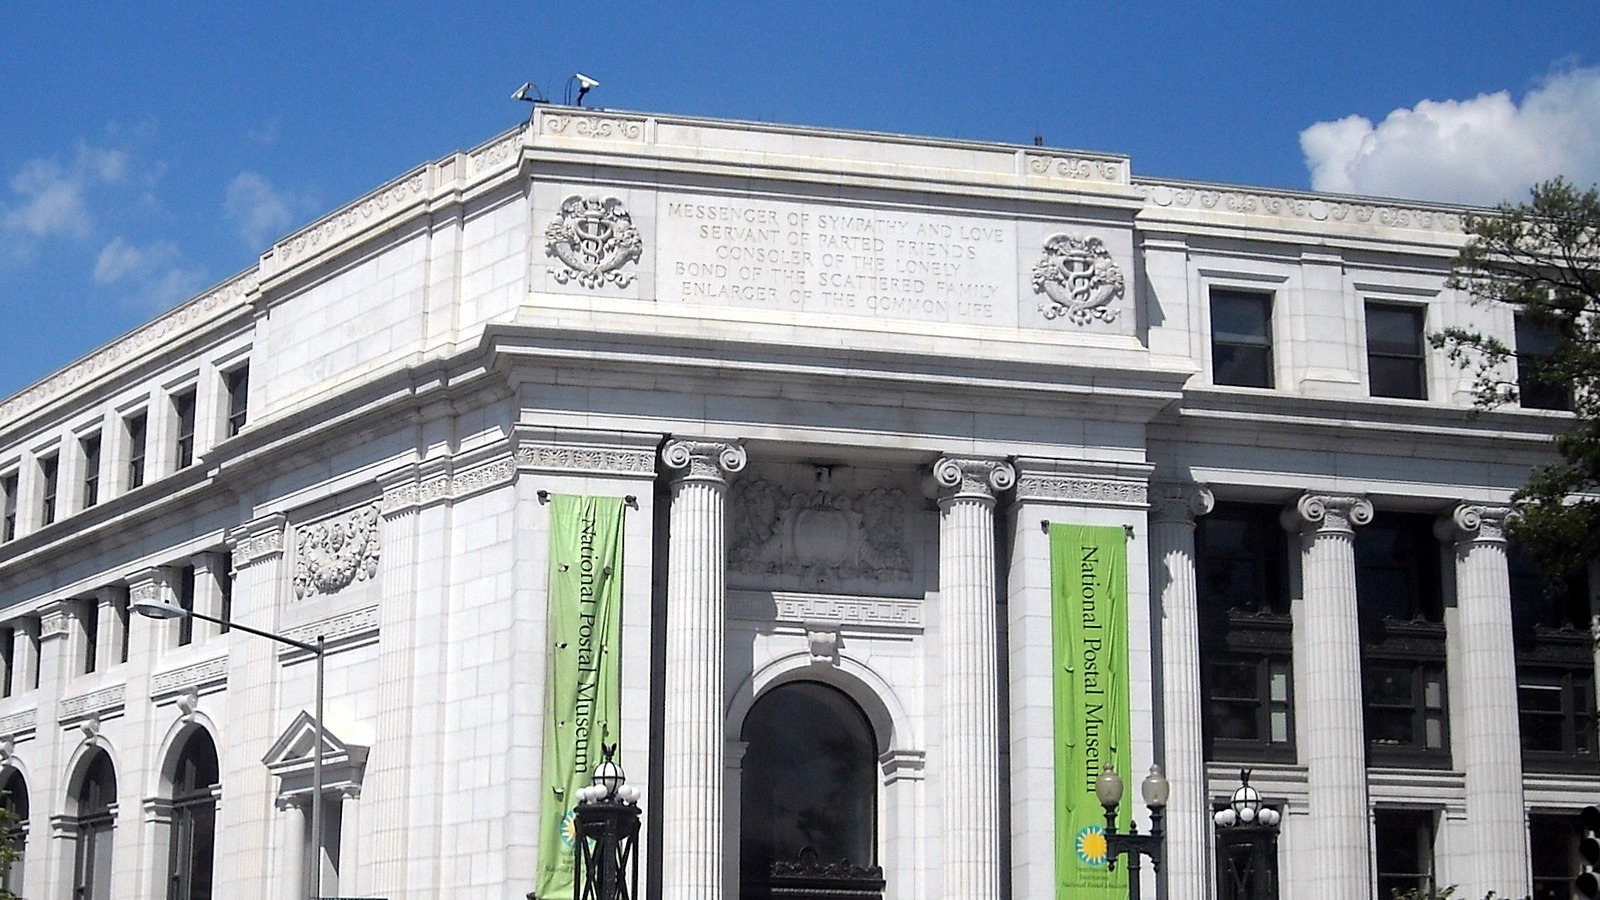
- [11]Postal Square Building, archival photograph, August 8, 2008 — AgnosticPreachersKid / Wikimedia Commons · Accessed 2026-11-06T14:18:27.055261+00:00 · Tier 1
- [12]CC BY-SA 3.0: licence for the cropped photograph — Creative Commons · Accessed 2026-11-06T14:18:27.568213+00:00 · Tier 1
This content is for informational and educational purposes only and is not financial advice. Options involve risk and are not suitable for every investor. Do your own research before trading.
Keep YieldCove close
Choose YieldCove as a preferred source for Top Stories in Google Search.
Run the numbers before you trade: the free wheel strategy calculator sizes the whole cycle, and the cash-secured put calculator shows the cash, return and breakeven of one put.