
Cooling CPI meets a fresh oil shock in the July 14 morning read
June inflation cooled sharply just as a renewed Strait of Hormuz shock lifted crude, leaving markets to weigh a friendlier rate signal against a fresh energy risk. This morning read maps the global handoff, the U.S. opening reaction and the next dated earnings for tracked names.
YieldCove Desk
3 min read
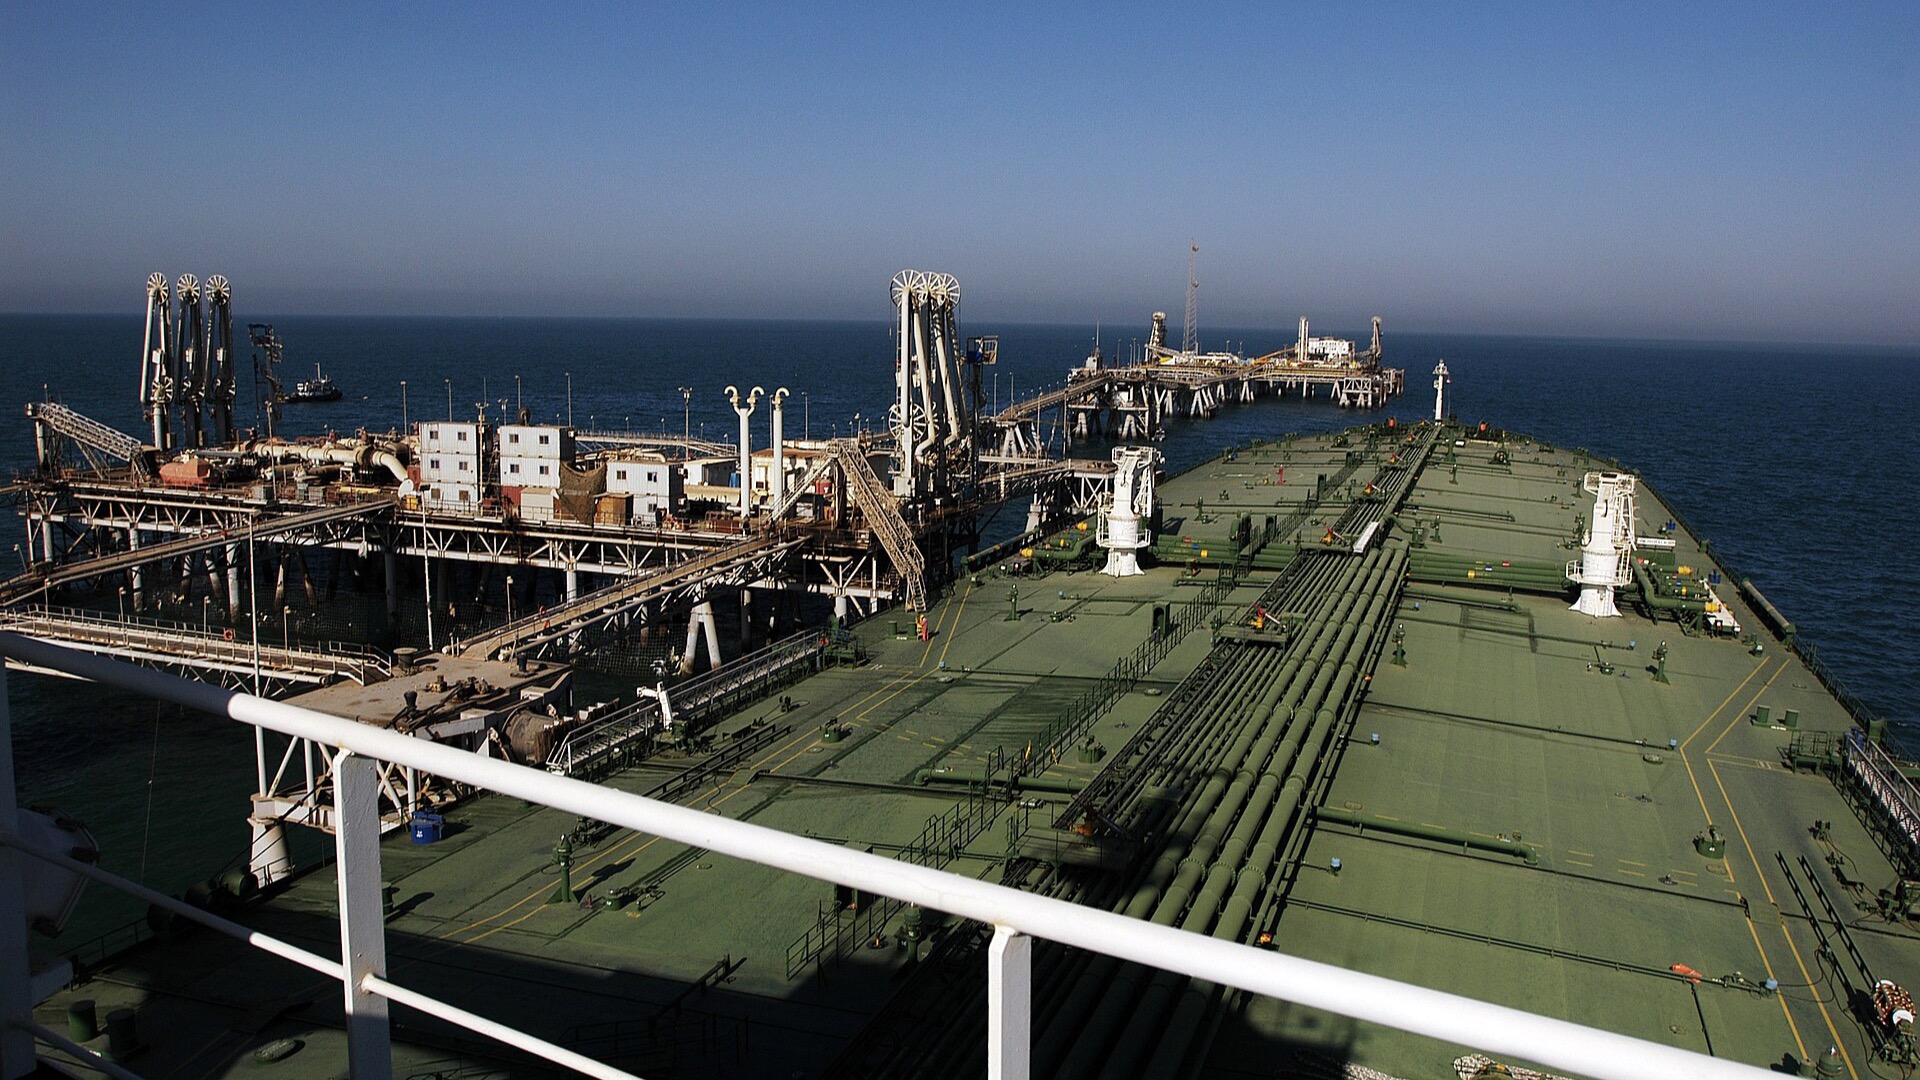
June U.S. CPI, month over month
-0.4%
May: +0.5%
June core CPI, month over month
0.0%
May: +0.2%
WTI crude near 10:05 a.m. ET
$79.75
+2.1%
U.S. 10-year yield near 10:00 a.m. ET
4.57%
Mon. close: 4.62%
VIX near 10:00 a.m. ET
16.41
-4.4%
TL;DR
A softer June inflation print pulled Treasury yields and the dollar lower, while the oil shock kept the inflation debate from disappearing. U.S. stocks opened modestly higher and volatility eased, but crude—not the equity index alone—is the cleaner intraday stress gauge for this session.
Macro overnight
The overnight session handed North America two opposing signals. Reuters reported that renewed U.S.-Iran tensions and a proposed 20% charge to guard Strait of Hormuz transit pushed Brent to $86.19 and WTI to $79.78 in early European trade. Equity futures were choppy at that point, but the tone improved after the 8:30 a.m. ET inflation release: by 10:15 a.m. ET the S&P 500 was up about 0.2%, the Nasdaq Composite 0.4%, the Dow 0.3% and the Russell 2000 0.6% from Monday’s close. Those are timestamped snapshots, not closing figures.
| Market | Level | Change vs. prior close | Read-through |
|---|---|---|---|
| Nikkei 225 | 67,743.50 | +0.7% | Japan finished firmer |
| Hang Seng | 24,340.73 | +0.5% | Hong Kong also advanced |
| Shanghai Composite | 3,967.13 | -0.7% | Mainland China lagged |
| Euro Stoxx 50 | 6,278.89 | +0.1% | Recovered from an initially weaker European open |
| FTSE 100 | 10,534.36 | +0.3% | London held a modest gain |
| S&P 500 | 7,528.58 | +0.2% | Small post-CPI advance |
| Nasdaq Composite | 25,975.15 | +0.4% | Growth shares led the early U.S. move |
Rates and currencies carried the inflation message more clearly. The official Treasury curve closed Monday with the 2-year at 4.26% and the 10-year at 4.62%. Around 10:00 a.m. ET Tuesday, the 10-year was near 4.57%, roughly five basis points below that official close, while the dollar index was down about 0.6% at 100.67. Gold futures were near $4,082, up about 1.9%, and WTI was near $79.75, up about 2.1%.
Inflation reset: cooler data, but not a clean all-clear
The Bureau of Labor Statistics reported that headline CPI fell 0.4% in June after a 0.5% increase in May. The 12-month rate slowed to 3.5% from 4.2%. Core CPI was unchanged on the month and rose 2.6% over 12 months, down from 2.9% in May. Energy did most of the monthly work: its index fell 5.7%, including a 9.7% drop in gasoline, while shelter still increased 0.1%. That composition matters because Tuesday’s rebound in crude could partially reverse the energy relief if it persists; one soft month does not settle the path of future inflation.
The split signal
Cooling core inflation supports the bond rally, but a durable oil shock would work in the opposite direction through fuel, transport and inflation expectations. The important question is whether crude holds the geopolitical premium after the first headline-driven move.
Your tickers
No material company-specific announcement from a primary issuer or major news outlet was confirmed for the tracked names after Monday’s U.S. close before this read was finalized, so we are not padding this section with price-action stories. The confirmed item worth carrying forward is the earnings calendar below; Nasdaq dates can change and should be treated as estimates until each issuer confirms them.
| Date | Ticker | Timing | Why it matters to the morning map |
|---|---|---|---|
| July 22, 2026 | GOOGL | After hours | AI and data-center spending read-through |
| July 22, 2026 | TSLA | After hours | High-volatility event for a held and watched name |
| July 23, 2026 | INTC | After hours | Semiconductor cycle and foundry execution |
| July 23, 2026 | NOK | Before market | Network-equipment demand signal |
| July 27, 2026 | AMKR | After hours | Packaging and semiconductor demand read-through |
What to watch today
- Fed Chair Kevin Warsh’s semiannual testimony: he repeated the June target range of 3.50%–3.75%, described activity as expanding at a solid pace and said the Committee has no tolerance for persistently elevated inflation.
- The oil–rates link: a renewed rise in WTI with the 10-year also turning higher would challenge the morning’s softer-inflation interpretation.
- Market breadth after the opening bounce: small caps led the early percentage move, while VIX fell below Monday’s close; either can reverse as geopolitical headlines evolve.
- No tracked company reports on Nasdaq’s July 14 calendar. The next clustered event window begins with GOOGL and TSLA on July 22.
For wheel traders, this is a regime-management morning rather than a single-signal one. Lower yields and softer core inflation can support duration-sensitive stocks, while higher oil can widen intraday ranges and reprice short-dated options. Treat the figures above as a dated market map, not a recommendation or a forecast of today’s close.
Sources
- [1]Consumer Price Index — June 2026 — U.S. Bureau of Labor Statistics · Accessed 2026-07-14 · Tier 1
- [2]Semiannual Monetary Policy Report to the Congress — Board of Governors of the Federal Reserve System · Accessed 2026-07-14 · Tier 1
- [3]Daily Treasury Par Yield Curve Rates — 2026 — U.S. Department of the Treasury · Accessed 2026-07-14 · Tier 1
- [4]Stocks mixed as oil rises after Trump’s Hormuz levy threat — Reuters via MSN · Accessed 2026-07-14 · Tier 2
- [5]World Indices market data — Yahoo Finance · Accessed 2026-07-14 · Tier 2
- [6]Commodities market data — Yahoo Finance · Accessed 2026-07-14 · Tier 2
- [7]CBOE Volatility Index market data — Yahoo Finance · Accessed 2026-07-14 · Tier 2
- [8]CBOE 10-Year Treasury Note Yield market data — Yahoo Finance · Accessed 2026-07-14 · Tier 2
- [9]U.S. Dollar Index market data — Yahoo Finance · Accessed 2026-07-14 · Tier 2
- [10]Earnings calendar — July 22, 2026 — Nasdaq · Accessed 2026-07-14 · Tier 1
- [11]Earnings calendar — July 23, 2026 — Nasdaq · Accessed 2026-07-14 · Tier 1
- [12]Earnings calendar — July 27, 2026 — Nasdaq · Accessed 2026-07-14 · Tier 1
This content is for informational and educational purposes only and is not financial advice. Options involve risk and are not suitable for every investor. Do your own research before trading.
Read next

Cheaper oil lifts futures, but Japan adds another rate hurdle
Falling oil and stronger equity futures extend the relief rally even as Japan tightens monetary policy. For premium sellers, calmer broad-market volatility must still be weighed against elevated bond yields and company-specific risks.
Futures rebound, but the Fed keeps the funding hurdle high
Equity futures are recovering as oil and volatility ease after the Fed’s rate increase. For premium sellers, the rebound does not erase higher financing costs or the distinction between cash yield and compensation for assignment risk.
Oil eases, but 5% Treasuries keep the Fed-day pressure on
A modest rebound in equity futures is running into stubbornly high bond yields before the Fed decision. For premium sellers, the distinction between temporary oil relief and lasting policy risk matters more than a greener opening screen.