
Weekly recap: Nasdaq falls 2.13% as oil and yields bite
The Nasdaq fell 2.13% from July 17 to July 24 while energy gained 3.36% and consumer discretionary lost 5.22%. An oil spike, 14–15 basis-point Treasury-yield increases and mixed reactions to major technology earnings set up a crowded Fed and earnings week.
YieldCove Desk
2 min read
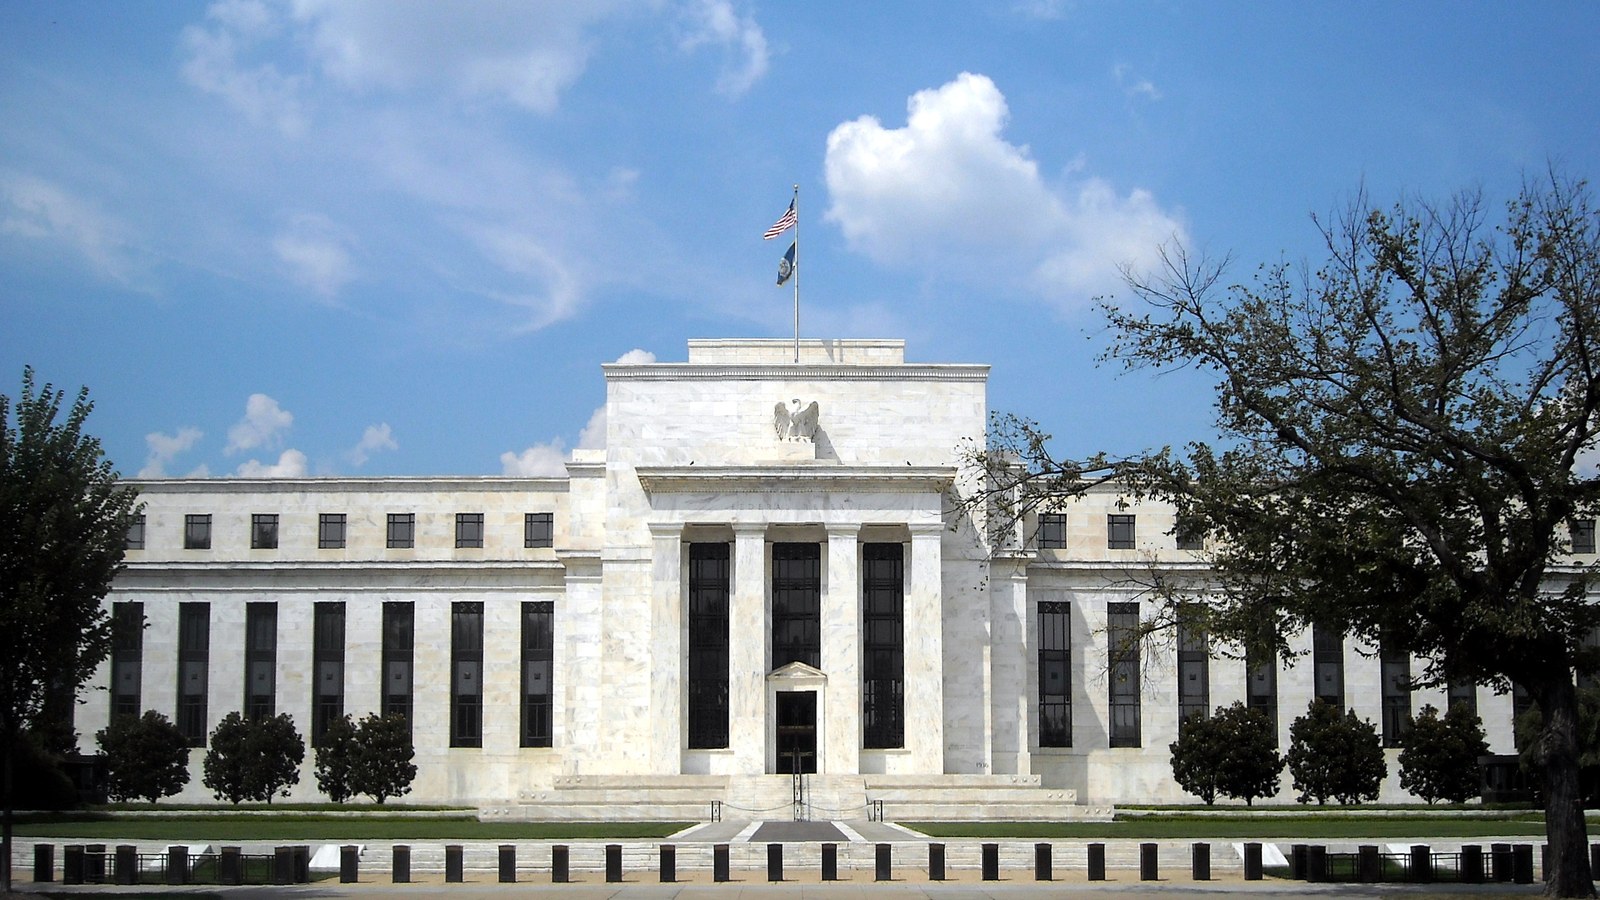
U.S. stocks ended the July 20–24, 2026 week lower, with a wide split under the headline indexes. The Nasdaq Composite fell most as artificial-intelligence spending worries deepened; energy led after crude oil briefly reached $102 a barrel. Rising Treasury yields put next week's Federal Reserve meeting and crowded earnings calendar in focus.
S&P 500
7,411.98
-0.61% week over week
Nasdaq Composite
24,975.82
-2.13% week over week
Dow Jones
51,947
-0.38% week over week
Cboe VIX
18.58
-1.0% vs. July 17
Energy sector (XLE)
+3.36%
Consumer discretionary (XLY)
-5.22%
U.S. 2-year yield
4.33%
+15 bp vs. July 17
U.S. 10-year yield
4.69%
+14 bp vs. July 17
The week in 5 points
- Growth stocks carried the decline. From the July 17 close to July 24, the Nasdaq lost 2.13%, compared with declines of 0.61% for the S&P 500 and 0.38% for the Dow.
- Sector leadership shifted toward real assets and defensives. Energy gained 3.36%, utilities rose 2.45% and industrials added 1.79%. Consumer discretionary fell 5.22%, communication services lost 3.94% and consumer staples declined 1.26%.
- Oil and rates tightened the backdrop. Brent touched $102 before retreating to $96.37 Friday. The official 2-year and 10-year Treasury yields ended at 4.33% and 4.69%, up 15 and 14 basis points from July 17.
- Strong technology results were not uniformly rewarded. Alphabet, Tesla and Intel reported revenue growth of 24%, 26% and 25%; their stocks still fell 7.79%, 17.81% and 2.86% for the week.
- Volatility ranged widely without ending higher. The VIX traded from 16.64 to 20.31 and closed at 18.58, below its July 17 close of 18.77. Several single-stock moves were far larger.
Sector scoreboard
| Rank | Sector | ETF | Weekly move |
|---|---|---|---|
| 1 | Energy | XLE | +3.36% |
| 2 | Utilities | XLU | +2.45% |
| 3 | Industrials | XLI | +1.79% |
| 9 | Consumer staples | XLP | -1.26% |
| 10 | Communication services | XLC | -3.94% |
| 11 | Consumer discretionary | XLY | -5.22% |
Your tickers this week
| Ticker | July 24 close | Weekly move | Verified context |
|---|---|---|---|
| CIFR | $23.15 | +31.83% | Largest verified tracked gain; no company-specific catalyst assigned |
| MU | $920.95 | +8.48% | Finished the week higher despite a 6.99% Friday decline |
| NBIS | $187.77 | +5.66% | Still higher for the week after a 15.03% Friday decline |
| TSLA | $313.03 | -17.81% | Q2 revenue rose 26%, while operating income fell 57% |
| HIMS | $28.09 | -14.46% | Large liquid decline; no unverified catalyst assigned |
| NOK | $9.10 | -10.08% | Earnings-week decline; price action is not treated as a forecast |
| GOOGL | $319.74 | -7.79% | Q2 revenue rose 24% and Cloud revenue rose 82% |
| INTC | $92.32 | -2.86% | Q2 revenue rose 25%; shares fell 7.89% on Friday |
The tracked universe combines YieldCove's live watchlist, open option positions, open wheel stock lots and long-term holdings. These are regular-session prices. A large move is a fact; a catalyst is not inferred when current issuer or major-outlet evidence does not establish one.
Notable earnings
| Company | Quarter | What was reported | What the market weighed |
|---|---|---|---|
| Alphabet | Q2 2026 | Revenue $119.8bn (+24%); Cloud $24.8bn (+82%); operating margin 34% | Rapid AI growth arrived alongside heavy infrastructure funding and spending |
| Tesla | Q2 2026 | Revenue $28.236bn (+26%); deliveries 480,126 (+25%) | Operating income fell 57% to $398m and operating margin narrowed to 1.4% |
| Intel | Q2 2026 | Revenue $16.1bn (+25%); non-GAAP EPS $0.42 | Q3 revenue guidance was $15.8bn–$16.8bn, while Friday's share reaction was negative |
Wheel seller takeaways
The VIX ended almost where it began, but TSLA, HIMS, NOK and GOOGL moved 8%–18%. That gap shows why index volatility and single-stock assignment risk differ. An educational wheel review keeps cash collateral fully reserved, treats earnings and the July 28–29 Federal Reserve meeting as separate event risks, and compares any per-share premium with the full 100-share obligation. Next week brings confirmed results for AMKR, MSFT, META, HOOD, SOFI, AAPL, AMZN and GDYN.
Next week
- Monday, July 27: Advance durable-goods data at 8:30 a.m. ET; AMKR is listed after the close.
- Tuesday, July 28: The two-day Federal Open Market Committee meeting begins; Consumer Confidence is due at 10:00 a.m. ET.
- Wednesday, July 29: The FOMC meeting concludes. Nasdaq lists SOFI before the open and MSFT, META and HOOD after the close.
- Thursday, July 30: Advance second-quarter GDP, June personal income and the PCE deflator, plus initial jobless claims, are scheduled for 8:30 a.m. ET. AAPL, AMZN and GDYN are listed after the close.
- Friday, July 31: The second-quarter Employment Cost Index is due at 8:30 a.m. ET and the final July Michigan consumer survey at 10:00 a.m. ET. Calendar dates and times can change.
Softer indexes and unusually large tracked-ticker moves delivered no simple message. Energy strength, higher yields and mixed earnings reactions can keep dispersion elevated into next week's Fed decision and mega-cap results. This recap is educational market information, not personalized financial advice or an instruction to trade.
Sources
- [1]S&P 500 Index daily price history — Cboe Global Markets · Accessed 2026-07-24 · Tier 1
- [2]S&P 500 delayed closing quote — July 24, 2026 — Cboe Global Markets · Accessed 2026-07-24 · Tier 1
- [3]Nasdaq Composite historical prices — July 17–24, 2026 — Nasdaq · Accessed 2026-07-24 · Tier 1
- [4]Nasdaq Composite closing quote — July 24, 2026 — Nasdaq · Accessed 2026-07-24 · Tier 1
- [5]Dow Jones Industrial Average daily price history (DJX) — Cboe Global Markets · Accessed 2026-07-24 · Tier 1
- [6]Dow Jones delayed closing quote (DJX) — July 24, 2026 — Cboe Global Markets · Accessed 2026-07-24 · Tier 1
- [7]Cboe VIX daily price history — Cboe Global Markets · Accessed 2026-07-24 · Tier 1
- [8]Cboe VIX delayed closing quote — July 24, 2026 — Cboe Global Markets · Accessed 2026-07-24 · Tier 1
- [9]Daily Treasury par yield curve rates — 2026 — U.S. Department of the Treasury · Accessed 2026-07-24 · Tier 1
- [10]Stocks edge back up as oil prices pause climb but yields hover near highs — Reuters via Euronext · Accessed 2026-07-24 · Tier 2
- [11]Official U.S. stock screener closing data — July 24, 2026 — Nasdaq · Accessed 2026-07-24 · Tier 1
- [12]Energy Select Sector SPDR quote and history — Nasdaq · Accessed 2026-07-24 · Tier 1
- [13]Utilities Select Sector SPDR quote and history — Nasdaq · Accessed 2026-07-24 · Tier 1
- [14]Industrial Select Sector SPDR quote and history — Nasdaq · Accessed 2026-07-24 · Tier 1
- [15]Consumer Staples Select Sector SPDR quote and history — Nasdaq · Accessed 2026-07-24 · Tier 1
- [16]Communication Services Select Sector SPDR quote and history — Nasdaq · Accessed 2026-07-24 · Tier 1
- [17]Consumer Discretionary Select Sector SPDR quote and history — Nasdaq · Accessed 2026-07-24 · Tier 1
- [18]Alphabet Q2 2026 results, Exhibit 99.1 — Alphabet / SEC EDGAR · Accessed 2026-07-24 · Tier 1
- [19]Tesla Q2 2026 update, Exhibit 99.1 — Tesla / SEC EDGAR · Accessed 2026-07-24 · Tier 1
- [20]Intel Q2 2026 earnings release, Exhibit 99.1 — Intel / SEC EDGAR · Accessed 2026-07-24 · Tier 1
- [21]Earnings calendar — July 27, 2026 — Nasdaq · Accessed 2026-07-24 · Tier 1
- [22]Earnings calendar — July 29, 2026 — Nasdaq · Accessed 2026-07-24 · Tier 1
- [23]Earnings calendar — July 30, 2026 — Nasdaq · Accessed 2026-07-24 · Tier 1
- [24]FOMC meeting calendars and information — 2026 — Federal Reserve Board · Accessed 2026-07-24 · Tier 1
- [25]Economic Indicators Calendar — July 2026 — Federal Reserve Bank of New York · Accessed 2026-07-24 · Tier 1
- [26]Release schedule — GDP and Personal Income and Outlays — U.S. Bureau of Economic Analysis · Accessed 2026-07-24 · Tier 1
- [27]Release calendar — July 2026 — U.S. Bureau of Labor Statistics · Accessed 2026-07-24 · Tier 1
- [28]Marriner S. Eccles Federal Reserve Board Building photograph — Wikimedia Commons · Accessed 2026-07-24 · Tier 1
This content is for informational and educational purposes only and is not financial advice. Options involve risk and are not suitable for every investor. Do your own research before trading.
Read next

Relief spreads, but index options resist the all-clear
The rebound widened as volatility fell, yet index options remained more put-heavy than stock options. For premium sellers, calmer prices do not establish a one-way market.

Cheaper oil lifts futures, but Japan adds another rate hurdle
Falling oil and stronger equity futures extend the relief rally even as Japan tightens monetary policy. For premium sellers, calmer broad-market volatility must still be weighed against elevated bond yields and company-specific risks.

Equal-weight resilience challenges the tech-led retreat
Equal-weight stocks held up as technology shares fell and volatility rose. For option sellers, the split exposes concentration risk rather than a clear signal of panic or confidence.