
Key takeaways
- AMD’s data-center revenue rose 97%, powering record quarterly sales.
- The US$17 billion fourth-quarter sales outlook comes with a lower adjusted gross-margin forecast.
- Shares rose further after hours, but cash generation lagged reported earnings.
- Old option marks are not executable prices for the post-earnings session.
AMD after hours, Nov 3, 19:08:52 ET
US$516.62
+6.76% versus regular close
AMD regular-session close, Nov 3
US$483.90
+US$17.06 / +3.65% versus Nov 2
Regular-session volume
32,065,405 shares
1.50× preceding 20-session average
Q4 2026 revenue outlook
US$17bn ±3%
Management forecast, not actual sales
Cboe stored 30-day IV reading
65.78%
Post-release IV and IV rank unverified
AI sales accelerate; cash conversion does not
AMD released third-quarter results at 16:15 ET on November 3, 2026. Revenue for the quarter ended September 26 was US$13.377 billion, up 45% on the company’s rounded comparison. Reported diluted earnings were US$1.46 per share; adjusted, non-GAAP earnings were US$2.09, versus US$1.20 a year earlier. These are different profit measures, not interchangeable versions of the same number. 1
The regular session finished at US$483.90, up US$17.06, or 3.65%, from November 2. Yahoo’s after-hours observation at 19:08:52 ET was US$516.6249, rounded here to US$516.62: a further 6.76% above the regular close. Regular-session volume was 32,065,405 shares, 1.50 times the preceding 20-session average of 21,429,920. After-hours prices are separate, changeable observations—not tomorrow’s opening price. 3 4
| Measure | Q3 2026 / outlook | Comparison / status |
|---|---|---|
| Quarterly revenue | 13.377 | 9.246 in Q3 2025 |
| Data Center revenue | 8.546 | 4.341 in Q3 2025 |
| Client and Gaming revenue | 3.722 | 4.048 in Q3 2025 |
| Embedded revenue | 1.109 | 0.857 in Q3 2025 |
| Free cash flow, non-GAAP | 0.554 | 1.530 in Q3 2025 |
| Q4 revenue forecast | 16.49–17.51 | 17.00 midpoint ±3%; not achieved yet |
Why investors are looking beyond the PC business
The strongest reported driver was Data Center: sales rose 97% to US$8.546 billion, supported by EPYC server processors and the launch of Instinct MI450 GPUs. That business supplied a calculated 63.9% of total quarterly revenue. AMD’s presentation shows Data Center operating income of US$2.882 billion, versus US$1.074 billion a year earlier. 1 2
- Client and Gaming sales fell 8%. Within that combined segment, client sales increased 7%, but gaming revenue dropped 40% to US$773 million. AI strength did not mean every business grew. 1
- Embedded sales rose 29% to US$1.109 billion, with growth across several industrial end markets. This provided another contributor beyond data centers. 1
- The regular-session chip backdrop was already positive: Nvidia gained 2.29%, Intel 0.97% and the SOXX semiconductor ETF 2.50%. These are pre-release, close-to-close comparisons, not proof that AMD’s later earnings caused peer moves. 5 6 7
The evening rally is consistent with investors welcoming the growth outlook, but a price move does not prove one exclusive cause. AMD forecasts fourth-quarter revenue of US$17 billion, plus or minus 3%—a calculated US$16.49–17.51 billion range. The midpoint implies roughly 27% sequential growth. 1 2
Management expects approximately 55% adjusted gross margin, down from the third quarter’s rounded 56%. More sales need not mean a higher gross-margin percentage. 1 2
AMD: 40 regular sessions through November 3
Daily regular-session closes only; excludes the after-hours earnings reaction. USD per share.
Source: Yahoo Finance daily AMD chart [3]; retrieved November 3, 2026, 19:08:57 ET. Unadjusted regular-session closes.
Revenue growth is the headline. Cash conversion and the margin forecast are the follow-up questions.
The counterweight: less cash from the quarter
Operating cash flow from continuing operations was US$1.202 billion, while capital spending was US$648 million. Subtracting the latter gives US$554 million of free cash flow, versus US$1.530 billion a year earlier—a calculated decline of 63.8%. Free cash flow is AMD’s supplemental non-GAAP liquidity measure, not net income. 1
Inventories increased to US$11.463 billion from US$8.468 billion in the previous quarter; receivables rose to US$9.209 billion from US$7.281 billion. Those balances make cash collection and inventory conversion useful checkpoints. They do not, by themselves, establish that customer demand is weak or that the growth forecast will fail. 2
What it means for option sellers
The earnings announcement has happened, but the first full post-report options session is November 4. Cboe’s snapshot retrieved at 19:08:57 ET lists 30-day implied volatility at 65.78%; sampled option trades are stamped in the regular session, before the release. That is not a verified post-release IV reading. IV rank was not independently established, so no “cheap” or “rich” ranking is assigned. 10
Implied volatility measures expected movement, not direction. A volatility decline can help a short option, all else equal, but an adverse stock move can overwhelm that benefit. For the wheel—selling a cash-secured put, potentially taking shares, then writing a covered call—the stock exposure remains real. A covered call limits upside without eliminating the underlying downside. 11 12
Illustrative math—not an option quote
For education only, suppose a standard 100-share November 20 US$500 put were sold for an assumed US$10 per share. Gross credit would be US$1,000 against US$50,000 cash reserved; breakeven would be US$490. At US$450 at expiry, the loss would be US$4,000 before fees. A US$550 covered call is a separate illustration of capped upside. These strikes are not recommendations, and the assumed premium is not a market quote. 10 11 12
What to watch next
- November 4: the first full post-results session can reveal the new stock-price range and option spreads. Check live prices before trading; no fresh bid, ask or post-release IV is asserted here.
- November 6, 08:30 ET: the October U.S. employment report. November 10, 08:30 ET: October CPI. November 20 option examples cross both releases. 9
- Through Q4 2026: compare deliveries, cash conversion and margins with management’s forecast. No next-results date is assumed here. 1 2
The macro backdrop still matters: on October 28, the Federal Reserve held its target range at 3.75–4.00%. Employment and inflation releases can change rate expectations and the valuation backdrop for chip stocks; that is a risk channel, not a predicted market reaction. 8 9
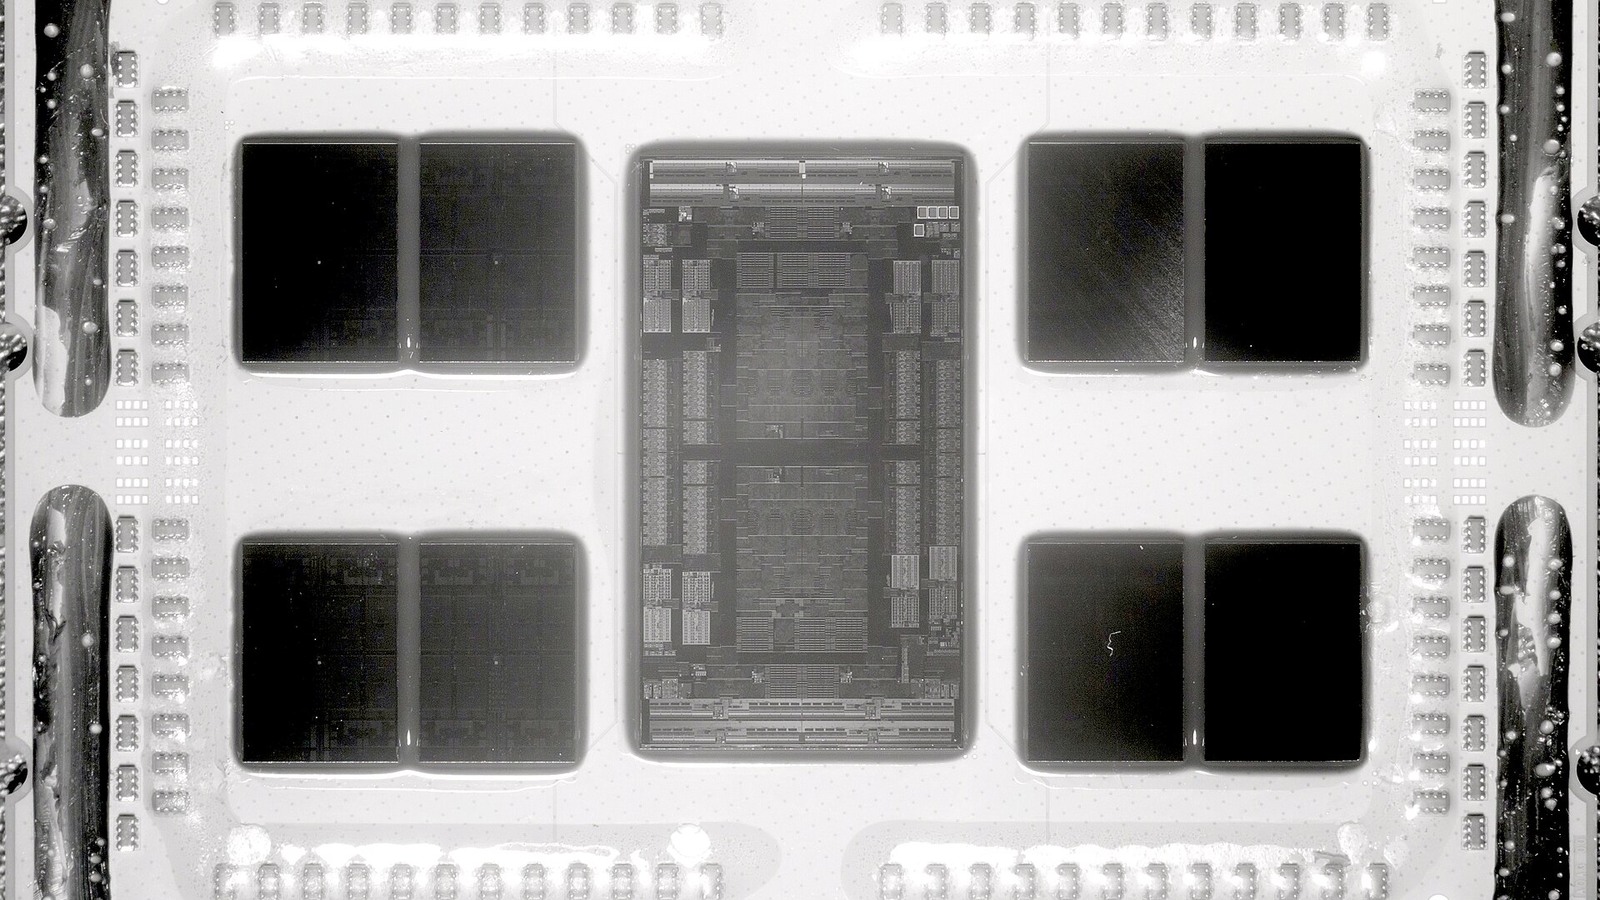
Photo context: the hero is an archival October 2019 near-infrared photograph of an AMD EPYC 7702 engineering sample with its lid removed—not a current MI450 product. Fritzchens Fritz released the photograph under CC0; it was cropped and resized. 13 14
Sources
- [1]AMD Q3 2026 results, financial tables and outlook — AMD · Accessed 2026-11-03T19:08:57.388933-05:00 · Tier 1
- [2]AMD Q3 2026 earnings slides, including segment and outlook tables — AMD · Accessed 2026-11-03T19:08:57.389651-05:00 · Tier 1
- [3]AMD daily regular-session prices and volume, accessed November 3 — Yahoo Finance · Accessed 2026-11-03T19:08:57.909262-05:00 · Tier 2
- [4]AMD November 3 minute prices, including after-hours trading — Yahoo Finance · Accessed 2026-11-03T19:08:57.563117-05:00 · Tier 2
- [5]Nvidia daily regular-session prices, November 3 — Yahoo Finance · Accessed 2026-11-03T19:08:57.919436-05:00 · Tier 2
- [6]Intel daily regular-session prices, November 3 — Yahoo Finance · Accessed 2026-11-03T19:08:57.991745-05:00 · Tier 2
- [7]SOXX daily regular-session prices, November 3 — Yahoo Finance · Accessed 2026-11-03T19:08:58.007357-05:00 · Tier 2
- [8]October 28, 2026 FOMC statement — Federal Reserve · Accessed 2026-11-03T19:08:57.390540-05:00 · Tier 1
- [9]November 2026 economic release calendar, list view — U.S. Bureau of Labor Statistics · Accessed 2026-11-03T19:10:51.024251-05:00 · Tier 1
- [10]AMD delayed options snapshot; distinguish regular-session option data from after-hours stock — Cboe · Accessed 2026-11-03T19:08:57.416369-05:00 · Tier 1
- [11]Cash-secured put: mechanics, volatility and assignment risks — Options Industry Council · Accessed 2026-11-03T19:08:57.391403-05:00 · Tier 1
- [12]Covered call: capped upside, downside and assignment risks — Options Industry Council · Accessed 2026-11-03T19:08:57.391834-05:00 · Tier 1
- [13]Archival AMD EPYC 7702 photograph: author, date and CC0 dedication — Wikimedia Commons · Accessed 2026-11-03T19:08:57.392554-05:00 · Tier 1
- [14]CC0 1.0 Universal Public Domain Dedication — Creative Commons · Accessed 2026-11-03T19:08:57.393241-05:00 · Tier 1
This content is for informational and educational purposes only and is not financial advice. Options involve risk and are not suitable for every investor. Do your own research before trading.
Keep YieldCove close
Choose YieldCove as a preferred source for Top Stories in Google Search.
Run the numbers before you trade: the free wheel strategy calculator sizes the whole cycle, and the cash-secured put calculator shows the cash, return and breakeven of one put.


