
Key takeaways
- Supermicro reported US$19.946 billion of quarterly sales, up 297.5% from a year earlier. [1]
- Its FY2027 sales outlook is US$72–82 billion, but operating cash flow was negative. [1]
- The dated after-hours stock gain is not a live Wednesday quote; post-earnings option prices still need a fresh check. [4,5]
Nov. 3 regular close [3]
US$31.39
+3.12%
Nov. 3, 7:59 p.m. ET [4]
US$33.65
+7.20% after hours
Nov. 3 share volume [3]
61.505 million
1.71× prior 20-session mean
Prior regular-session IV30 [5]
92.50%
Not a post-earnings reading
FY2027 sales guidance [1]
US$72–82 billion
Management outlook, not a result
A huge sales quarter, with a cash-flow catch
Super Micro Computer released fiscal first-quarter 2027 results on November 3 for the three months ended September 30, 2026. Sales reached US$19.946 billion, compared with US$5.018 billion a year earlier, a calculated increase of 297.5%. Diluted earnings were US$1.75 a share under GAAP and US$1.81 on the company’s adjusted, non-GAAP basis. [1]
The stock had already closed Tuesday at US$31.39, up US$0.95, or 3.12%, before the release. Stock Analysis then showed US$33.65 at 7:59 p.m. ET on November 3, up another US$2.26, or 7.20%, from that close. These are dated observations, not live November 4 prices; Wednesday’s regular-session reaction is still ahead. [3,4]
Trading was active even before the announcement: Yahoo’s daily series records 61,505,000 shares for November 3. That is 1.71 times its preceding 20-session average of 35,947,900 shares. Volume vendors differ, so the comparison here deliberately uses one provider’s series throughout rather than mixing counts. [3]
Why the announcement mattered
The demand story was not entirely new. On October 20, Supermicro had already lifted its preliminary quarterly sales range to US$18.5–19.5 billion from US$14.5–15.5 billion, citing increased demand for AI platforms. The reported figure still exceeded the revised upper end by about US$446 million, or 2.3%. [1,2]
The forward numbers give investors something else to weigh. Management expects second-quarter sales of US$19.5–21.5 billion, with adjusted diluted earnings of US$1.66–1.90 per share, for the quarter ending December 31. Its full-year fiscal 2027 sales range is US$72–82 billion; neither range is a guaranteed outcome. [1]
| Measure | Fiscal Q1 2027 | Comparison or outlook |
|---|---|---|
| Net sales | US$19.946 billion | US$5.018 billion a year earlier |
| GAAP gross margin | 12.7% | 9.3% year earlier; 17.5% previous quarter |
| Diluted EPS: GAAP / adjusted | US$1.75 / US$1.81 | US$0.26 / US$0.35 a year earlier |
| Operating cash flow | US$434 million used | Not the same as accounting profit |
| Fiscal Q2 sales guidance | US$19.5–21.5 billion | Quarter ends December 31, 2026 |
| FY2027 sales guidance | US$72–82 billion | Management forecast, not reported sales |
The weak spot is what those sales leave behind. GAAP gross margin improved from a year earlier, but fell 4.8 percentage points from the previous quarter to 12.7%. Despite reporting US$1.594 billion of net income, the company used US$434 million of operating cash, so earnings and cash generation tell different stories. [1]
The release’s cash-flow table shows cash absorbed by receivables and inventory. At September 30, Supermicro reported US$6.9 billion of cash against US$8.6 billion of bank debt and convertible notes. That makes collection, inventory conversion and funding important checks on the growth narrative, rather than footnotes to it. [1]
- Sector context: Dell rose 3.98% and HPE 3.73% in the November 3 regular session. Those moves happened before Supermicro’s release and cannot be attributed to its after-hours announcement. [6,7]
- Supplier context: NVIDIA’s next results are scheduled for November 17, with a 5 p.m. ET conference call. That is another dated AI-infrastructure checkpoint, not proof of Supermicro’s future orders. [8]
SMCI: 40 regular-session closes
US dollars through November 3, 2026. Excludes after-hours trading; closing prices are not intraday support guarantees. [3]
Source: Yahoo Finance daily chart API; 40 sessions through 2026-11-03; retrieved 2026-11-04 06:16 ET. [3]
What it means for option sellers
Cboe’s retrieved snapshot carries a 30-day implied-volatility reading of 92.495%, rounded here to 92.50%. Treat it as a prior regular-session reading, not a fresh post-earnings option valuation: the options market has not reopened for Wednesday. IV rank was not independently established, so no rank is supplied. [5]
High implied volatility can mean larger premiums, but it is not a safety score. After earnings, reduced uncertainty can lower option time value, while an adverse stock move can still overwhelm the credit received. A cash-secured put is a commitment to buy shares if assigned, not a substitute for deciding whether the business and price are acceptable. [10]
Worked example — assumptions, not a quote
For a hypothetical standard 100-share contract, a US$30 put sold for an assumed US$1 per share brings US$100 gross credit against US$3,000 at the strike. Expiry breakeven is US$29; if the stock falls to zero, the loss is US$2,900 before fees. A US$35 covered call is a separate educational strike example: it caps upside above that strike and does not remove share-price downside. No expiry or executable premium is being proposed. [10,11]
- For the put side of a wheel, the useful question is whether assignment would remain acceptable after a reversal, not simply whether the headline was strong. [10]
- For the covered-call side, a rally can mean shares are called away; the premium is compensation for giving up upside, not free income. [11]
- Any real setup needs current bid/ask prices, liquidity and a new catalyst check. Neither the historical IV reading nor the illustrative strikes establish a trade today.
The main risk
The company says these unaudited figures are preliminary and its closing procedures are not complete. Final results may change, while a fast share-price reversal can outweigh option premium; the growth headline does not settle either risk. [1,10]
A record sales quarter is not the same thing as cash in the bank.
What to watch next
November 4 is the first regular session after this release: watch whether the after-hours move survives normal trading and newly priced options. The November 6 U.S. employment report and November 10 consumer-price report are both scheduled for 8:30 a.m. ET; their outcomes were not yet available at this article’s research cutoff. Macro surprises could change the risk backdrop without changing Supermicro’s reported quarter. [9]
November 17 brings NVIDIA’s results, followed by the December 31 end of Supermicro’s guided second quarter. The cited Supermicro release does not announce its next earnings-publication date; quarter-end is not that date. The next business test is whether shipments translate into collected cash while margins hold up. [1,8]
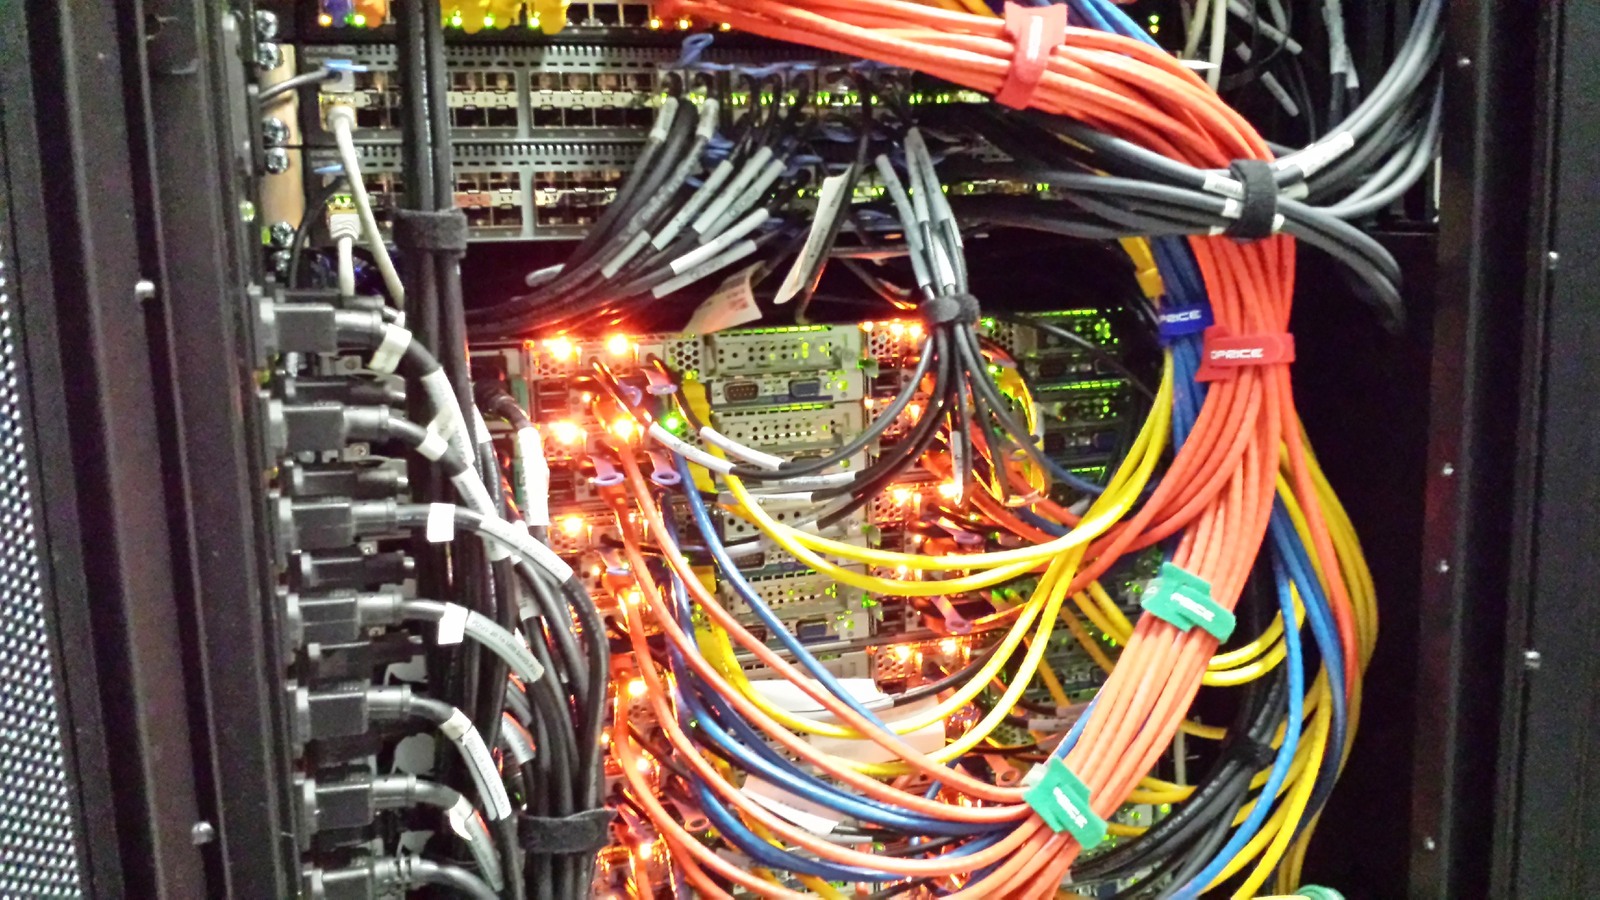
Photo: archival May 15, 2015 server racks at Ontario Datacenter, California, used as a sector illustration—not identified as a Supermicro facility or current equipment. Ontariodatacenter / Wikimedia Commons, CC BY-SA 4.0; resized and recompressed, adaptation under the same licence. [12]
Sources
- [1]Fiscal Q1 2027 results, November 3, 2026 — Super Micro Computer · Accessed 2026-11-04T06:08:12.640660-05:00 · Tier 1
- [2]Fiscal Q1 2027 preliminary business update, October 20, 2026 — Super Micro Computer · Accessed 2026-11-04T06:08:12.661619-05:00 · Tier 1
- [3]SMCI daily regular-session price and volume series — Yahoo Finance · Accessed 2026-11-04T06:16:02.343939-05:00 · Tier 3
- [4]SMCI dated regular close and 7:59 p.m. ET after-hours quote — Stock Analysis · Accessed 2026-11-04T06:07:39.567179-05:00 · Tier 3
- [5]SMCI delayed snapshot; prior regular-session IV30 — Cboe · Accessed 2026-11-04T06:14:31.582455-05:00 · Tier 1
- [6]DELL daily regular-session price series — Yahoo Finance · Accessed 2026-11-04T06:16:02.344692-05:00 · Tier 3
- [7]HPE daily regular-session price series — Yahoo Finance · Accessed 2026-11-04T06:16:02.345077-05:00 · Tier 3
- [8]Third-quarter FY2027 results conference announcement — NVIDIA · Accessed 2026-11-04T06:08:12.684587-05:00 · Tier 1
- [9]November 2026 release schedule — U.S. Bureau of Labor Statistics · Accessed 2026-11-04T06:07:39.590836-05:00 · Tier 1
- [10]Cash-secured put: structure and risks — Options Industry Council · Accessed 2026-11-04T06:15:15.633876-05:00 · Tier 1
- [11]Covered call: structure and risks — Options Industry Council · Accessed 2026-11-04T06:15:15.660647-05:00 · Tier 1
- [12]Ontario Datacenter California 5: photo, author and licence — Wikimedia Commons / Ontariodatacenter · Accessed 2026-11-04T06:09:58.038973-05:00 · Tier 1
This content is for informational and educational purposes only and is not financial advice. Options involve risk and are not suitable for every investor. Do your own research before trading.
Keep YieldCove close
Choose YieldCove as a preferred source for Top Stories in Google Search.
Run the numbers before you trade: the free wheel strategy calculator sizes the whole cycle, and the cash-secured put calculator shows the cash, return and breakeven of one put.


