
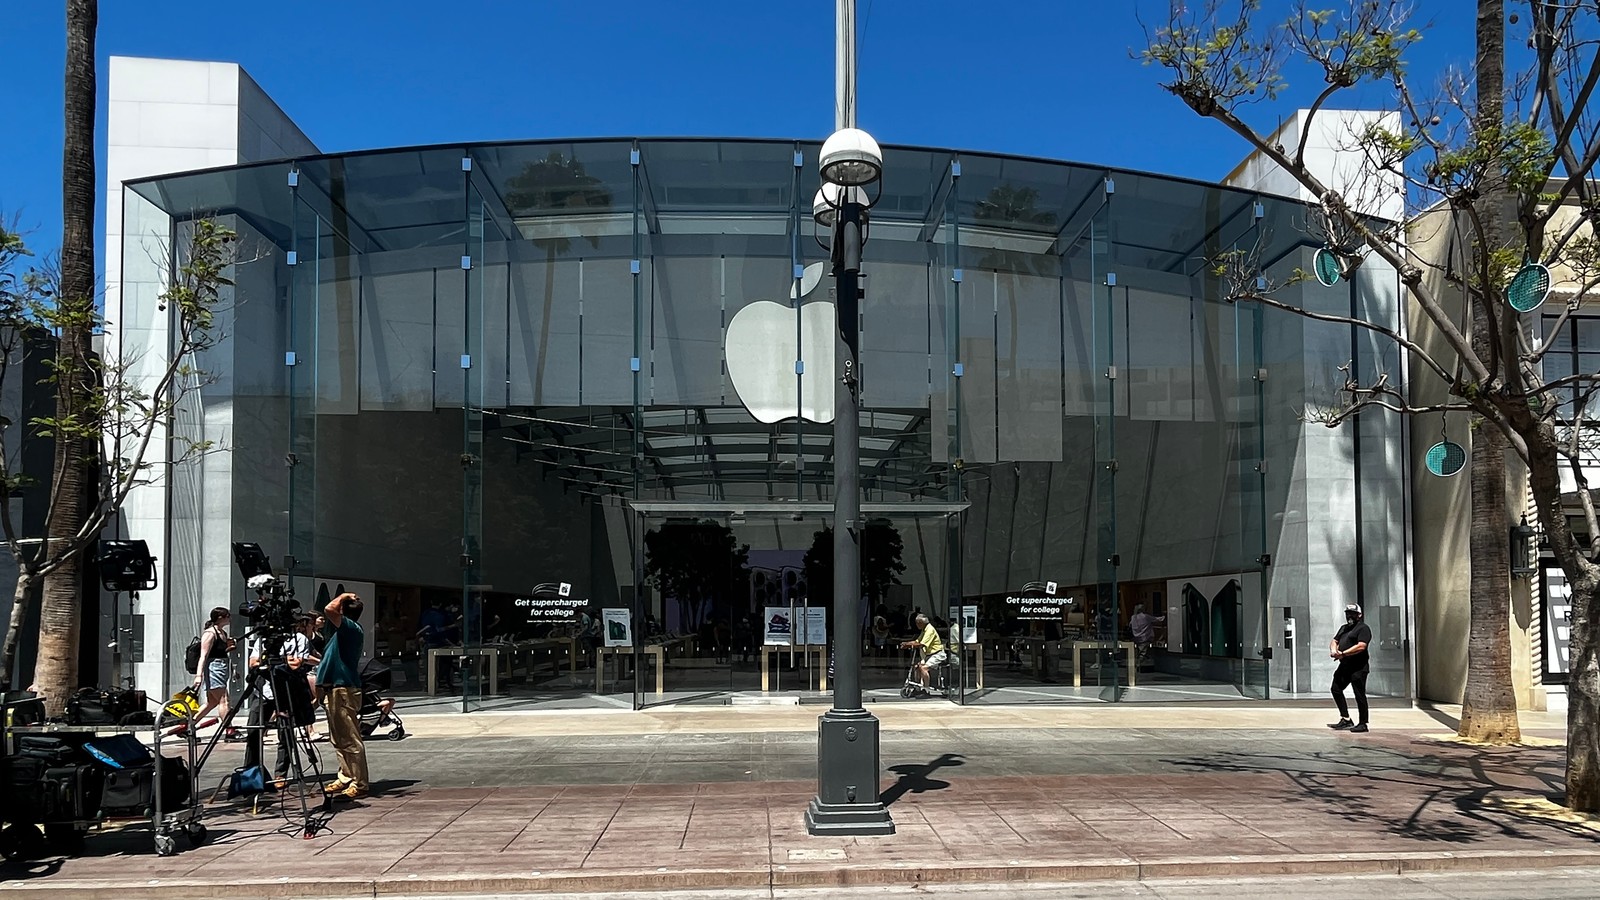
Key takeaways
- Apple fell 1.23% on Friday; Monday’s earnings discussion is still ahead.
- July’s strong margin included tariff refunds, making the comparison less straightforward.
- November 6 options cross earnings risk; an attractive premium does not remove assignment risk.
October 30 close
US$344.63
-US$4.28
Regular-session move
-1.23%
Versus October 29
Daily-history share volume
67.80 million
1.75× preceding 20-session average
Next results call
November 2, 5 p.m. ET
Official Apple event listing
November 6 US$345 call IV
45.07%
Last-session delayed snapshot; not IV rank
What happened: a pullback before the next test
Apple closed Friday, October 30 at US$344.63, down US$4.28, or 1.23%, from Thursday’s US$348.91. Yahoo’s daily history recorded 67,797,500 shares, about 1.75 times the preceding 20-session average of 38,682,545. These are completed-session figures, not Saturday prices or executable quotes. [1]
The next company-specific test is close: Apple’s official listing schedules its fiscal fourth-quarter results conference call for Monday, November 2 at 5 p.m. ET. That is the call time, not a separately confirmed earnings-release minute. The results remain unknown. [2]
Apple: 20 completed trading sessions
Unadjusted daily closes, October 5–30, 2026; US dollars per share. [1]
Source: Yahoo Finance daily history, October 5–30, 2026; retrieved October 31, 2026 at 09:23 ET. [1]
Why the backdrop matters
Apple’s decline came alongside weakness in another major technology name: Amazon fell 1.41% to US$240.35. Amazon’s October 29 release paired 39.3% AWS sales growth with a US$42.4 billion trailing-12-month free-cash-flow outflow. That illustrates the sector’s growth-versus-spending tension; it does not prove a single cause for Apple’s move. [3,4]
Apple has a different immediate test: demand for its devices and services, and the profitability of that demand. Its October 28 announcement introduced MacBook Pro with PROLED XDR Display, with availability beginning November 6. A product announcement establishes a calendar milestone, not sales success or a guaranteed earnings boost. [5]
The financial baseline is strong—but needs context
| Measure | Reported value | Important context |
|---|---|---|
| Revenue | US$109.4 billion | Up 16% year over year |
| Diluted earnings per share | US$2.02 | Up 29% year over year |
| Gross margin | 50.1% | About 2 percentage points helped by tariff refunds |
| EPS tariff-refund benefit | US$0.11 | Included in reported EPS |
The key distinction is recurring performance versus a favorable item. July’s 50.1% gross margin benefited by approximately two percentage points from tariff refunds, while reported EPS included an US$0.11 benefit. Treating that margin as an automatic floor for the next quarter would ignore the disclosed help. [6]
Monday’s useful questions are therefore broader than whether revenue rises: does management describe sustained device demand, how much does the product mix support profitability, and what does the next-quarter outlook imply? Those are questions for the release and call, not outcomes that can be filled in before they happen.
What it means for option sellers
Yahoo’s last-session options page showed 45.07% implied volatility for the November 6 US$345 call, whose listed last trade was October 30 at 3:59 p.m. ET. The page says options data are 15-minute delayed. This contract-specific reading is not a stock-wide IV measure; a comparable current IV rank was not verified. Check live prices before trading. [7]
The Options Industry Council explains that implied volatility often rises before earnings and can fall after uncertainty clears. That “volatility crush” can help a seller, all else equal, but a share-price gap can overwhelm the premium collected. Neither a large IV number nor a Friday decline establishes an attractive selling opportunity. [8,9]
The main risk: earnings can jump past a strike
Options lasting beyond Monday’s results discussion retain earnings exposure. A lower put strike is not a stop-loss, and a covered call does not protect against a large stock decline. Assignment can turn an income idea into a substantial share commitment. [2,9,10]
Illustration only—not a quote or recommendation
Assume a standard 100-share contract: a hypothetical US$330 put sold for US$4 per share would bring in US$400 and require US$33,000 to fund assignment. Expiry breakeven would be US$326. At a US$310 expiry share price, the position would lose US$1,600 before fees. The US$4 premium is invented solely for this arithmetic example, not presented as market data. [9]
- Put-side lens: US$330 is 4.25% below Friday’s close, but that distance is not an earnings-risk estimate or a probability of profit. No executable setup is being proposed.
- Call-side lens: an illustrative US$360 covered call would cap share-sale upside at its strike if assigned; it would not erase downside risk. No premium is assumed. [10]
- Wheel discipline: the put-to-shares-to-covered-call sequence still requires acceptable share ownership. Rolling changes a contract; it does not make an unfavorable underlying move disappear. [9,10]
The earnings calendar matters more than the appearance of easy premium.
What to watch next
| Date | Event | Why it matters |
|---|---|---|
| November 2, 5 p.m. | Apple fiscal Q4 results call | Reported results and management’s outlook |
| November 6 | New MacBook Pro availability begins | Product-cycle execution, not guaranteed sales |
| November 6, 8:30 a.m. | October Employment Situation | Labor-market and interest-rate expectations |
The Federal Reserve held its target range at 3.75–4.00% on October 28 and said inflation remains elevated. The November 6 jobs release adds a separate macro risk for contracts spanning next week. Cash reserved for put assignment also has an opportunity cost; the Fed’s policy range is not a promised brokerage-cash yield. [11,12]
This is an educational news analysis, not personal financial advice. Options can produce substantial losses. Examples exclude fees and taxes; historical prices and delayed snapshots must be rebuilt from live data before any trade.
Sources
- [1]AAPL daily price and volume history, through October 30, 2026 — Yahoo Finance · Accessed 2026-10-31T09:23:39.648177-04:00 · Tier 2
- [2]FY 26 Fourth Quarter Results — official event feed — Apple Investor Relations · Accessed 2026-10-31T09:23:39.547246-04:00 · Tier 1
- [3]Amazon.com Announces Third Quarter Results, October 29, 2026 — Amazon · Accessed 2026-10-31T09:23:39.551682-04:00 · Tier 1
- [4]AMZN daily price history, through October 30, 2026 — Yahoo Finance · Accessed 2026-10-31T09:23:40.064324-04:00 · Tier 2
- [5]MacBook Pro with PROLED XDR Display announcement, October 28, 2026 — Apple Newsroom · Accessed 2026-10-31T09:27:13.495397-04:00 · Tier 1
- [6]Apple reports third quarter results, July 30, 2026 — Apple Newsroom · Accessed 2026-10-31T09:23:39.548426-04:00 · Tier 1
- [7]AAPL US$345-strike option observations; last-session data, 15-minute delayed — Yahoo Finance · Accessed 2026-10-31T09:26:30.944653-04:00 · Tier 2
- [8]The Crush Is Real — implied volatility and earnings — Options Industry Council · Accessed 2026-10-31T09:26:30.918686-04:00 · Tier 1
- [9]Cash-Secured Put — mechanics and risks — Options Industry Council · Accessed 2026-10-31T09:25:31.805462-04:00 · Tier 1
- [10]Covered Call (Buy/Write) — mechanics and risks — Options Industry Council · Accessed 2026-10-31T09:25:31.834114-04:00 · Tier 1
- [11]October 28, 2026 FOMC statement — Federal Reserve · Accessed 2026-10-31T09:23:39.550914-04:00 · Tier 1
- [12]November 2026 official release schedule — U.S. Bureau of Labor Statistics · Accessed 2026-10-31T09:23:39.550066-04:00 · Tier 1
- [13]Third Street Promenade (Santa Monica) — Apple Store; photograph and CC0 license — Wikimedia Commons / Benoît Prieur · Accessed 2026-10-31T09:23:39.552310-04:00 · Tier 1
This content is for informational and educational purposes only and is not financial advice. Options involve risk and are not suitable for every investor. Do your own research before trading.
Keep YieldCove close
Choose YieldCove as a preferred source for Top Stories in Google Search.
Run the numbers before you trade: the free wheel strategy calculator sizes the whole cycle, and the cash-secured put calculator shows the cash, return and breakeven of one put.


