
Key takeaways
- Palantir fell 6.27% on Friday before Monday’s earnings release.
- The coming report will test a US$2.160–US$2.164 billion revenue outlook, not a guaranteed result.
- Earnings-week option premiums reflect uncertainty; a lower put strike does not remove gap risk.
October 30 close
US$184.11
−US$12.31
Regular-session change
−6.27%
Versus October 29
Daily-history share volume
27.01 million
1.20× preceding 20-session average
Next earnings webcast
November 2, 5 p.m. ET
Release after the market close
Nov. 6 US$185 call IV
120.68%
Last-session delayed snapshot; not IV rank
What happened: a sharp fall before the growth test
Palantir closed Friday, October 30 at US$184.11, down US$12.31, or 6.27%, from Thursday’s US$196.42. Yahoo’s daily historical data recorded 27,007,300 shares, about 1.20 times the preceding 20-session average of 22,599,880. These are completed-session figures, not Saturday prices or executable quotes. [1]
The immediate company-specific event is Monday, November 2: Palantir says it will release third-quarter results after U.S. markets close and hold its webcast at 5 p.m. ET. The quarter ended September 30. That leaves the earnings outcome unknown, even after Friday’s decline. [2]
Why it happened: the AI trade faces a higher bar
Palantir’s fall overlapped a broader retreat from technology and AI shares. CNN reported that the Nasdaq Composite lost 2.86% and the S&P 500 fell 1.82% on Friday as recent earnings revived questions about the returns on heavy AI spending. That provides market context, not proof that one headline caused Palantir’s entire move. [4]
Software peers were weak too: ServiceNow fell 4.15% to US$105.12, while Snowflake dropped 7.32% to US$306.08. These businesses are not interchangeable, and their results cannot substitute for Palantir’s. The comparison shows that Friday’s pressure extended beyond a single stock. [5,6]
Friday’s software sell-off
October 30, 2026 regular-session close-to-close changes. [1,5,6]
Source: Yahoo Finance daily historical prices for PLTR, NOW and SNOW; October 30, 2026 session, retrieved October 31 at 11:10 ET. [1,5,6]
The numbers Monday must put in context
| Measure | Reported figure or outlook | Comparison / period |
|---|---|---|
| Revenue | US$1.935 billion | Q2; +93% year over year |
| U.S. commercial revenue | US$764 million | Q2; +149% year over year |
| U.S. government revenue | US$809 million | Q2; +90% year over year |
| Operating margin | 47% GAAP / 62% adjusted | Q2; different accounting measures |
| Q3 revenue guidance | US$2.160–US$2.164 billion | Issued August 3 |
| Full-year revenue guidance | US$8.150–US$8.158 billion | 2026 outlook issued August 3 |
The strength of that baseline is exactly why the next report matters. The midpoint of the Q3 revenue outlook is US$2.162 billion, about 11.7% above the exact Q2 revenue of US$1.935464 billion. This is a comparison of management’s August projection with a completed quarter—not a forecast that Monday’s numbers will land there. [3]
Profit quality also deserves attention. Palantir’s adjusted operating income excludes stock-based compensation and related employer payroll taxes; its 62% adjusted operating margin therefore is not the same measure as its 47% GAAP margin. Reading only the larger number would miss a disclosed accounting distinction. [3]
- U.S. commercial: does the next report support continued customer demand after Q2’s 149% growth? [3]
- Government: does revenue momentum continue after Q2’s 90% increase, and what does management say about timing? [3]
- Outlook: compare any revised annual revenue range with August’s US$8.150–US$8.158 billion baseline. [3]
What it means for option sellers
Yahoo’s last-session options page showed 120.68% implied volatility for the November 6 US$185 call, whose listed last trade was October 30 at 3:59 p.m. ET. The page labels its options data as 15-minute delayed. This is one contract’s IV, not a stock-wide measure or a 120.68% probability of a move; a comparable current IV rank was not verified. Check live prices before trading. [7]
The Options Industry Council explains that IV often rises before earnings and can fall once the uncertainty clears. A seller may benefit from that repricing, all else equal, but a share-price gap can overwhelm the collected premium. A large IV reading alone does not establish that an option is expensive relative to its own history. [8]
For wheel strategies, the practical distinction is between income and the share obligation underneath it. A cash-secured put can become a stock purchase at the strike, while a covered call limits the sale price of shares but leaves substantial downside exposure. Rolling either position does not make the original economic risk disappear. [9,10]
Educational strike math—not a trade recommendation
Assume a standard 100-share contract: a hypothetical US$170 put requires US$170 × 100 = US$17,000 of strike cash before fees. Its expiration breakeven is US$170 minus premium per share. A US$200 covered call sets a US$200-per-share sale obligation if assigned; that is not guaranteed profit. No premium or fill is assumed. [9,10]
The main risk is the earnings gap
November 6 contracts extend beyond Monday’s scheduled results. Neither the illustrative US$170 put nor the US$200 covered call is a protective floor: the stock can fall sharply, assignment can occur, and fees reduce results. These are educational strike examples, not screened setups or instructions to trade. [2,7,9,10]
Risks to keep separate
- Earnings gap: Monday’s news can move shares beyond the premium cushion. [2,8,9]
- Assignment and downside: a put can become shares; a covered call retains stock risk. [9,10]
- Snapshot limits: one contract’s IV is not IV rank or an executable quote. [7,8]
An educational reassessment plan
- After reopening, a hypothetical review would refresh prices and spreads rather than assume Friday’s snapshot remains available. [7]
- After November 2 results, compare actual revenue, margins and guidance with the August baseline. [2,3]
- Recheck the November 3 and November 6 labor-release calendar before interpreting the remaining week’s risk. [11]
A bigger earnings premium is payment for uncertainty, not protection from it.
What to watch next
| Date | Event | Why it matters |
|---|---|---|
| November 2 | Palantir results after the close; webcast 5 p.m. | Growth, margins and any revised guidance |
| November 3 | September JOLTS, 10 a.m. | A wider-market labor-demand checkpoint |
| November 6 | October Employment Situation, 8:30 a.m. | Macro risk before the November 6 option expiry |
Monday’s useful comparison is the reported result against the company’s own prior outlook, alongside the explanation for any change. The BLS labor releases add separate market-wide uncertainty later in the week; they do not predict Palantir’s sales. Any fresh options assessment needs rebuilt prices and spreads after the market reopens, rather than treating a Friday snapshot as a standing opportunity. [2,3,7,11]
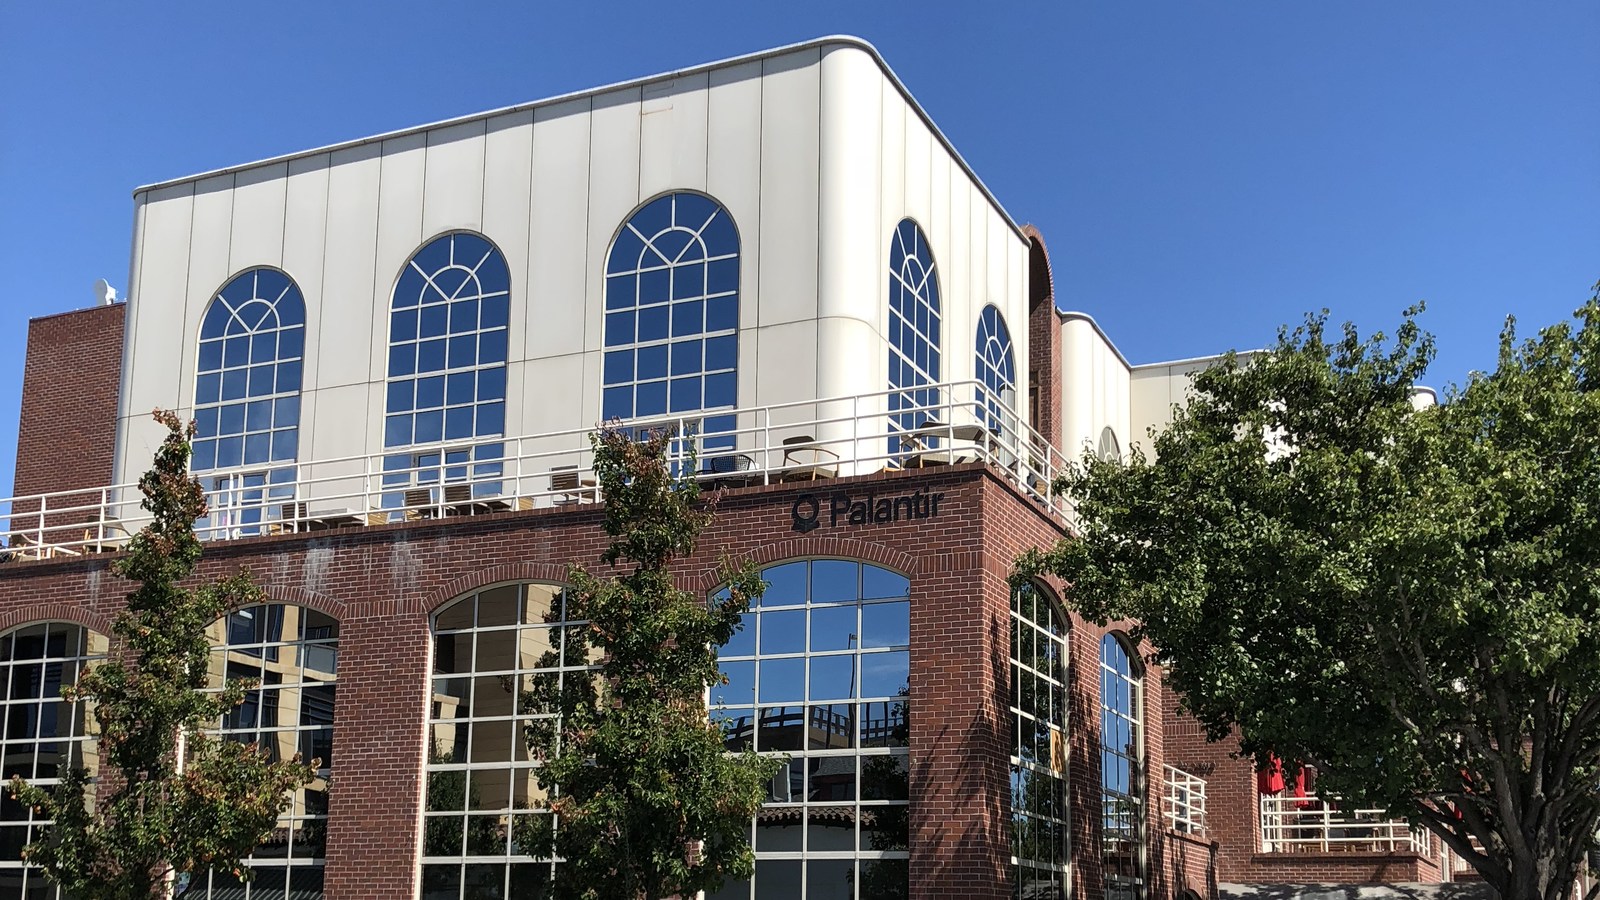
Hero: archival 2018 photograph by FASTILY, cropped and resized. The adapted photo is licensed CC BY-SA 4.0; it is not evidence of Palantir’s current headquarters. [12,13]
Sources
- [1]Palantir daily historical prices and share volume — Yahoo Finance · Accessed 2026-10-31T11:10:44.729286-04:00 · Tier 2
- [2]Third-quarter 2026 earnings release and webcast date — Palantir Technologies / Business Wire, via Yahoo Finance · Accessed 2026-10-31T11:10:45.349461-04:00 · Tier 1
- [3]Q2 2026 results and Q3/full-year guidance, August 3 — Palantir Technologies · Accessed 2026-10-31T11:11:17-04:00 · Tier 1
- [4]October 30 market sell-off and AI-investment concerns — CNN Business · Accessed 2026-10-31T11:10:46.007026-04:00 · Tier 2
- [5]ServiceNow daily historical prices — Yahoo Finance · Accessed 2026-10-31T11:10:44.731106-04:00 · Tier 2
- [6]Snowflake daily historical prices — Yahoo Finance · Accessed 2026-10-31T11:10:44.732287-04:00 · Tier 2
- [7]November 6 PLTR options: last-session 15-minute-delayed snapshot — Yahoo Finance · Accessed 2026-10-31T11:11:17-04:00 · Tier 2
- [8]The Crush Is Real: implied volatility around earnings — Options Industry Council · Accessed 2026-10-31T11:11:17-04:00 · Tier 1
- [9]Cash-Secured Put: mechanics and risks — Options Industry Council · Accessed 2026-10-31T11:10:46.031397-04:00 · Tier 1
- [10]Covered Call (Buy/Write): mechanics and risks — Options Industry Council · Accessed 2026-10-31T11:10:46.048254-04:00 · Tier 1
- [11]November 2026 release calendar — U.S. Bureau of Labor Statistics · Accessed 2026-10-31T11:11:17-04:00 · Tier 1
- [12]Palantir archival photograph and author/license declaration — FASTILY / Wikimedia Commons · Accessed 2026-10-31T11:10:46.050153-04:00 · Tier 1
- [13]Creative Commons Attribution-ShareAlike 4.0 terms — Creative Commons · Accessed 2026-10-31T11:10:46.240400-04:00 · Tier 1
This content is for informational and educational purposes only and is not financial advice. Options involve risk and are not suitable for every investor. Do your own research before trading.
Keep YieldCove close
Choose YieldCove as a preferred source for Top Stories in Google Search.
Run the numbers before you trade: the free wheel strategy calculator sizes the whole cycle, and the cash-secured put calculator shows the cash, return and breakeven of one put.


