
Key takeaways
- ENPH traded at $24.80 in a dated premarket snapshot, down 16.67% from Tuesday’s close.
- Q4 revenue guidance is $225–$255 million, below Q3’s $293.3 million.
- Weak residential demand matters now; AI-power shipments remain a 2028 expectation.
- Last-available option metrics are not fresh post-earnings trading quotes. [1,2,5]
Oct 28, 06:27 ET snapshot
US$24.80
Versus Oct 27 regular close
−16.67%
Oct 27 daily-bar volume
16,279,600 shares
3.42× prior 20-session average
Q3 revenue
US$293.3M
−28.5% year over year
Q4 revenue outlook
US$225M–$255M
Last-available 30-day IV
70.34%
Delayed provider estimate; not a live quote
What happened: a weaker outlook meets a lower share price
Enphase released third-quarter results on October 27 at 4:05 p.m. Eastern. By the October 28, 06:27 ET OptionCharts snapshot, ENPH was $24.80, down $4.96, or 16.67%, from Tuesday’s $29.76 regular close. That close was already down $0.60, or 1.98%, from Monday. All dollar figures are U.S. dollars; these observations are dated, not live entry prices. [1,2,5]
Yahoo Finance’s October 27 historical daily bar records 16,279,600 shares, versus a calculated 4,766,565-share average over the previous 20 sessions: 3.42 times normal for that comparison. This uses historical-bar volume, not the vendor’s separate headline volume field. The early decline followed an outlook pointing to lower sales and margins; it does not establish every investor’s motive. [1,2]
Q3 revenue was $293.329 million, down 28.5% from $410.427 million a year earlier. GAAP diluted earnings were $0.17 per share; adjusted, non-GAAP EPS was $0.41, versus $0.90 last year. Investment impairments reduced those current-quarter EPS figures by $0.15 and $0.14 respectively. Adjusted earnings are not interchangeable with GAAP results. [1]
| Metric | Q3 2026 actual | Q4 2026 guidance |
|---|---|---|
| Revenue | $293.3M | $225M–$255M |
| Non-GAAP gross margin | 45.0% | 40.0%–43.0% |
| Battery shipments | 129.9 MWh | 100–120 MWh |
| Company-labelled safe-harbor revenue | $85.0M | About $51.2M |
ENPH: 26 sessions before the premarket reset
Daily closes through October 27, 2026. The October 28 premarket fall is not plotted. Prices, not total returns. [2]
Source: Yahoo Finance unadjusted daily chart, retrieved October 28, 2026 at 06:28 ET. [2]
Why the operating picture weakened
Management says global sell-through—the company’s measure of downstream sales—rose about 1% sequentially, short of its 10% growth expectation. U.S. sell-through rose 5% from Q2 but fell 35% from a year earlier; Europe fell 12% sequentially. Enphase points to higher interest rates and the expired Section 25D federal tax credit as U.S. residential-solar headwinds. These are the company’s explanations, not independently measured customer intentions. [1]
- The Q4 revenue midpoint is $240 million, 18.2% below the precise Q3 revenue figure. The outlook assumes sell-through falling 10% sequentially. [1]
- Non-GAAP gross margin slipped from 46.8% in Q2 to 45.0% in Q3, driven by product mix. Q4 guidance includes approximately two percentage points of reciprocal-tariff pressure. [1]
- The balance sheet held $931.8 million of cash, cash equivalents and marketable securities, but quarterly operating cash flow was only about $0.1 million. Liquidity and current cash generation are different measures. [1]
The sector did not move uniformly before the report: SolarEdge closed October 27 up 1.64% at $32.16, while First Solar gained 4.58% to $175.85. These are same-session solar-stock comparisons, not identical business models or proof that Enphase’s later outlook caused their moves. The contrast discourages treating the whole sector as one earnings trade. [2–4]
The AI timeline is not a near-term sales rescue
Enphase demonstrated 13.8 kV AC-to-800 VDC conversion with its IQ solid-state transformer. But management still targets customer pilots in 2027 and commercial shipments beginning in 2028. Development engagements are not disclosed booked sales, and testing or qualification can slip. [1]
A technology milestone can widen the opportunity without repairing next quarter’s revenue.
What it means for option sellers
OptionCharts displayed 30-day implied volatility of 70.34% and IV rank of 32.1% when retrieved at 06:27 ET on October 28. The site labels options 15-minute delayed. With the regular options market closed, these are last-available provider estimates, not newly executable post-earnings quotes. Check live prices before trading; the snapshot cannot establish an actual earnings-related IV drop. [5]
For the wheel, selling a cash-secured put creates a potential share-purchase obligation; selling a covered call after assignment limits upside while retaining share downside. Earnings can remove uncertainty and allow IV to fall, but a large stock-price gap can overwhelm that benefit. This report is already public; a next Enphase earnings date is not confirmed here. [1,8,9]
Worked math, not a quoted trade
Assume a hypothetical $22 put collects $1 per share on a standard 100-share contract. Gross credit is $100, the purchase obligation is $2,200, and breakeven is $21. Maximum loss at a zero share price is $2,100 before fees. A hypothetical $30 covered call would cap the share-sale price at $30 if assigned. Neither example is a verified contract, available premium or recommendation. [8,9]
Risks and the research checklist
- Demand: weaker installations, tariffs and product mix can pressure earnings even after a large share-price decline. [1]
- Assignment: premium is limited; a put can require buying shares far above their market value, and a covered call is not downside insurance. [8,9]
- Before evaluating any sale: refresh bid/ask spreads, open interest, collateral and the calendar. A roll adds a new obligation rather than guaranteeing recovery. [8,9]
What to watch next
- October 28, 2:00 p.m. ET: the Fed’s scheduled meeting release, followed by its 2:30 p.m. press conference. September 16’s target range was 3.75%–4.00%; today’s decision is still unknown. [6,7]
- October 30 and November 20: listed ENPH expirations are risk checkpoints, not proposed holding periods or assurances that event risk has ended. [5]
- By year-end 2026: management targets 34.5 kV validation and a megawatt-scale IQ SST demonstration. Then come planned 2027 pilots and expected 2028 shipments, subject to execution. [1]
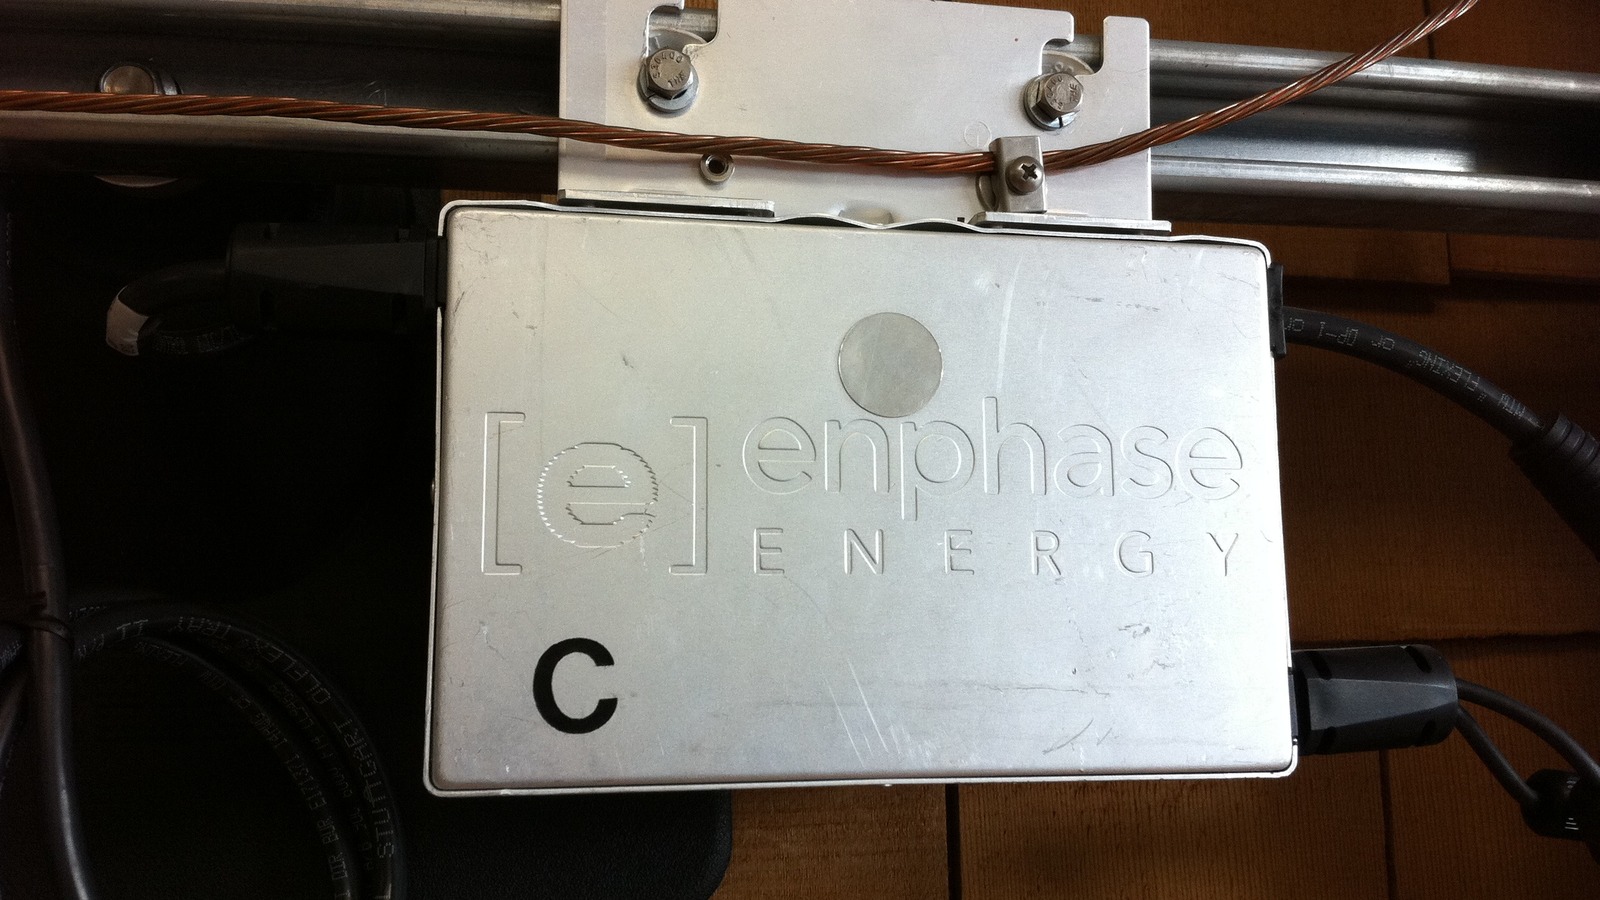
Photo: Maury Markowitz / Wikimedia Commons, CC BY-SA 3.0. Archival February 9, 2011 M190 installation, not IQ SST hardware; cropped/resized, adaptation under the same license.
Educational news, not personal investment advice. Options can cause substantial losses; forecasts and delayed prices can change.
Sources
- [1]Third-quarter 2026 results and Q4 outlook — Enphase Energy via GlobeNewswire · Accessed 2026-10-28T06:27:06.747868-04:00 · Tier 1
- [2]ENPH historical daily price and volume — Yahoo Finance · Accessed 2026-10-28T06:28:34.751701-04:00 · Tier 2
- [3]SEDG historical daily price — Yahoo Finance · Accessed 2026-10-28T06:26:56.733278-04:00 · Tier 2
- [4]FSLR historical daily price — Yahoo Finance · Accessed 2026-10-28T06:26:56.733898-04:00 · Tier 2
- [5]ENPH delayed overview: premarket price and option metrics — OptionCharts · Accessed 2026-10-28T10:27:05.820763+00:00 · Tier 3
- [6]September 16, 2026 FOMC statement — Federal Reserve · Accessed 2026-10-28T06:26:57.051424-04:00 · Tier 1
- [7]October 2026 calendar: FOMC meeting and press conference — Federal Reserve · Accessed 2026-10-28T06:26:57.057379-04:00 · Tier 1
- [8]Cash-Secured Put: mechanics and risks — Options Industry Council · Accessed 2026-10-28T06:26:57.078210-04:00 · Tier 1
- [9]Covered Call (Buy/Write): mechanics and risks — Options Industry Council · Accessed 2026-10-28T06:26:57.093588-04:00 · Tier 1
- [10]Enphase M190.jpg: original photograph and rights — Maury Markowitz / Wikimedia Commons · Accessed 2026-10-28T06:26:57.182982-04:00 · Tier 1
- [11]Creative Commons Attribution-ShareAlike 3.0 license — Creative Commons · Accessed 2026-10-28T06:26:57.229318-04:00 · Tier 1
This content is for informational and educational purposes only and is not financial advice. Options involve risk and are not suitable for every investor. Do your own research before trading.
Keep YieldCove close
Choose YieldCove as a preferred source for Top Stories in Google Search.
Run the numbers before you trade: the free wheel strategy calculator sizes the whole cycle, and the cash-secured put calculator shows the cash, return and breakeven of one put.


