
Key takeaways
- Robinhood posted record quarterly revenue, but crypto revenue fell 55% from a year earlier.
- HOOD was $88.51 in the October 28, 09:07 ET premarket snapshot, down 6.40%.
- Rising costs and weaker interest income complicate the growth story.
- Last-available option metrics are not fresh post-earnings trading quotes. [1–3]
Oct 28, 09:07 ET snapshot
US$88.51
Versus Oct 27 regular close
−6.40%
Oct 27 daily-bar volume
26,828,600 shares
1.43× prior 20-session average
Q3 total net revenue
US$1.424B
+12% year over year, company-rounded
Q3 crypto revenue
US$120M
−55% year over year
Last-available 30-day IV
66.62%
Delayed provider estimate; not a live quote
What happened: record sales, a lower share price
Robinhood released third-quarter results on October 27 at 4:05 p.m. Eastern, covering the quarter ended September 30. Its detailed accounts show $1.424 billion in net revenue, versus $1.274 billion a year earlier. Yet GAAP diluted earnings fell to $0.51 per share from $0.61. All dollar figures here are U.S. dollars. [1]
At 09:07 ET on October 28, OptionCharts showed HOOD at $88.51, down $6.05, or 6.40%, from Tuesday’s $94.56 regular close. That close had risen $1.72, or 1.85%, from Monday. The earnings-related premarket decline followed a positive regular session; the two observations should not be mixed. [2,3]
Tuesday’s Yahoo historical daily bar records 26,828,600 shares. The calculated average for the preceding 20 sessions is 18,739,285 shares, making Tuesday’s volume 1.43 times that benchmark. This is historical-bar volume, not today’s partial-session volume or the quote page’s separate headline field. [2]
| Measure | Q3 2026 | Year-over-year change |
|---|---|---|
| Net revenue | $1,424M | +12% |
| Options revenue | $399M | +31% |
| Crypto revenue | $120M | −55% |
| Net interest revenue | $415M | −9% |
| Operating expenses, GAAP | $739M | +16% |
| Diluted EPS, GAAP | $0.51 | −16% |
HOOD: 26 sessions leading into earnings
Unadjusted daily closes, September 22–October 27, 2026. The October 28 premarket move is not plotted. Price, not total return. [2]
Source: Yahoo Finance daily chart; retrieved October 28, 2026 at 09:08 ET. [2]
Why the mix matters more than the record
The release shows a business growing in different directions. Total transaction revenue rose 19% to $867 million, but crypto was a drag: crypto trading volume fell 38% to $50 billion. Meanwhile, equity revenue rose 41% to $121 million and event-contract revenue reached $173 million, more than six times the year-earlier level. [1]
- Options were a bright spot: 905 million contracts traded, up 48%, supported $399 million of revenue, up 31%. Activity and revenue do not grow at identical rates. [1]
- Interest income weakened as securities lending and short-term rates fell, according to management. More interest-earning assets partly offset that pressure. [1]
- GAAP expenses grew faster than revenue. Management cites credit-loss provisions, Trump Accounts and Rothera costs, plus marketing and growth investments. Net income also included a $67 million unrealized investment loss, mainly linked to Robinhood Ventures Fund I. This is corporate accounting, not a customer-trading result. [1]
There were offsets: net deposits reached $15.7 billion and Gold subscribers rose 34% to 5.2 million. Those figures support customer-growth momentum, but deposits are not revenue. The weak spots help explain a cautious reading of the report; they do not prove every seller’s motive. [1]
Tuesday’s peer tape was mixed before Robinhood reported: Coinbase gained 0.93% to $161.09, Schwab fell 0.48% to $89.30, and Interactive Brokers gained 2.06% to $82.25. These are sector comparisons from the same completed session, not evidence that Robinhood’s later announcement caused peers to move. [4–6]
A lower adjusted-cost ceiling is not a GAAP cost promise
Robinhood cut the top of its 2026 adjusted operating-expense-and-share-based-compensation outlook by $25 million, to $2.675–$2.750 billion. The measure excludes credit-loss provisions and other specified items. It is not guidance for total GAAP operating expenses. [1]
Record activity can coexist with weaker earnings when revenue mix and costs move against each other.
What it means for option sellers
OptionCharts displayed 30-day implied volatility of 66.62% and IV rank of 40.01% when retrieved at 09:07 ET. Its options data are 15-minute delayed. With the regular options market still closed, these are last-available estimates, not newly executable post-earnings prices. They do not establish whether IV will fall after the opening; check live prices before trading. [3]
For the wheel, a cash-secured put exchanges limited premium for a potential share-purchase obligation. A covered call on owned shares limits upside but leaves substantial downside. Lower IV can reduce an option’s value, all else equal, yet a stock-price gap can overwhelm that benefit. Yesterday’s earnings are public; event risk has not disappeared. [1,9,10]
Worked math, not a quoted trade
Assume a hypothetical $80 put collects $2 per share on a standard 100-share contract. Gross credit is $200; the purchase obligation is $8,000; breakeven is $78. Maximum loss at a zero share price is $7,800 before fees. A hypothetical $95 covered call would cap the assigned share-sale price at $95. These are arbitrary educational examples, not verified contracts, available premiums or recommendations. [9,10]
- Risk check: falling crypto activity, credit costs and regulatory uncertainty can pressure the business even after a large stock decline. [1]
- Research checklist: refresh spreads, open interest, cash collateral and the event calendar. A roll creates a new obligation; it does not guarantee recovery. [9,10]
What to watch next
- October 28, 2:00 p.m. ET: the scheduled Fed meeting release, followed by the 2:30 p.m. press conference. September 16’s target range was 3.75%–4.00%; today’s decision is still pending. Interest rates matter directly to Robinhood’s disclosed interest-revenue pressures. [1,7,8]
- October 30 and November 20: listed HOOD expirations are calendar checkpoints, not proposed holding periods. The next Robinhood earnings date is not established by the sources cited here. [1,3]
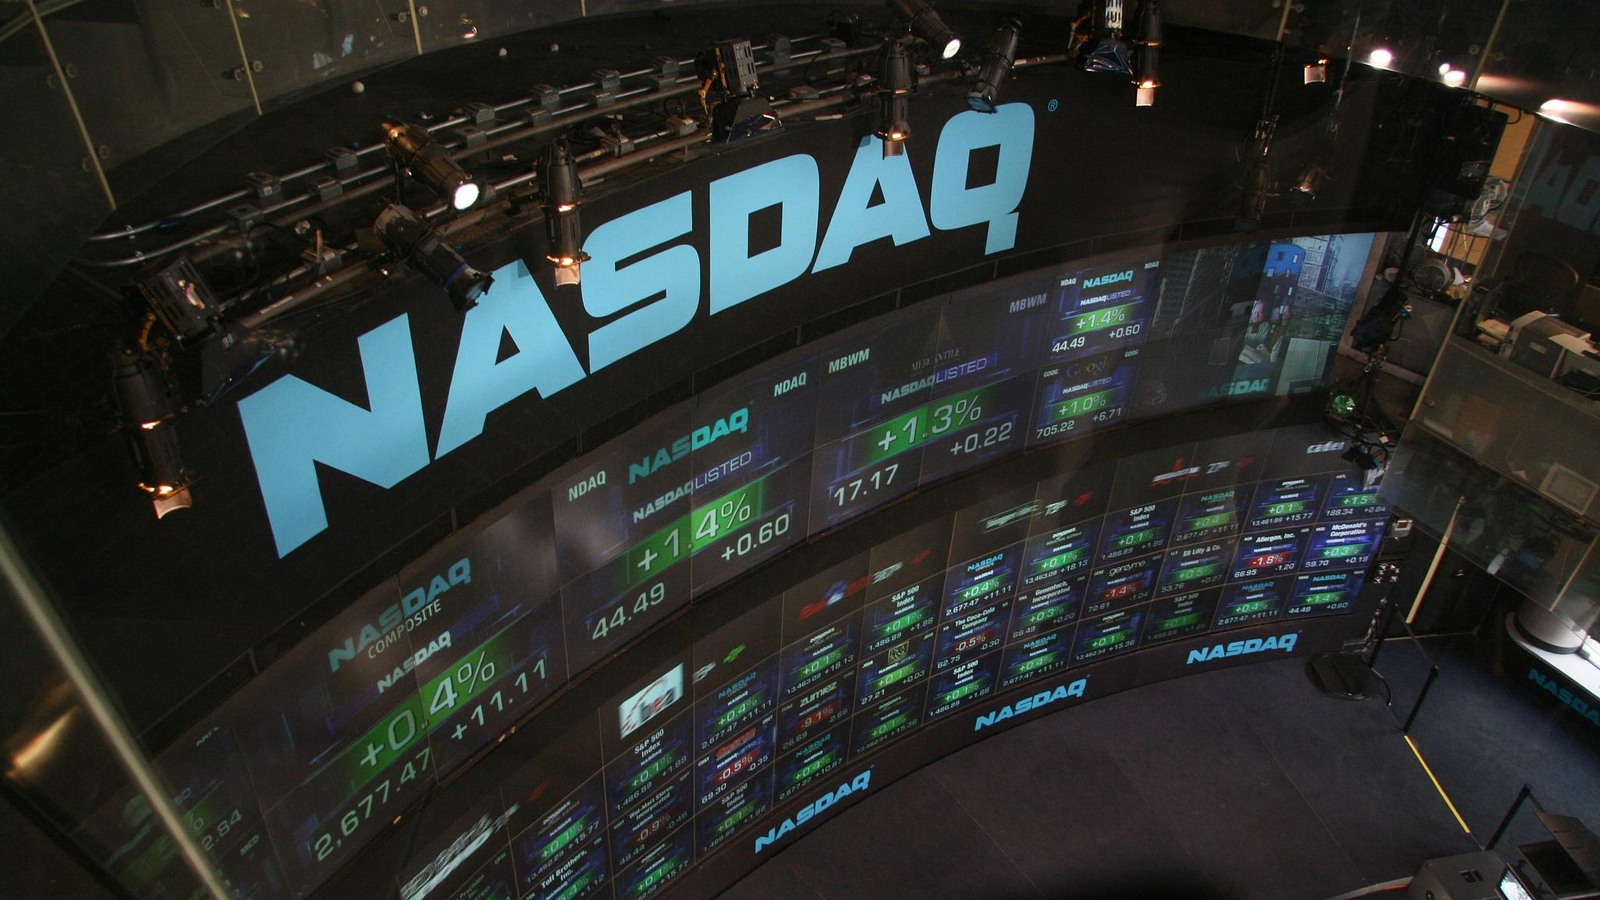
Photo: bfishadow / Wikimedia Commons, CC BY 2.0. Archival December 2007 Nasdaq displays; cropped/resized. The screens are not current prices or Robinhood results. [11]
Educational news, not personal investment advice. Options can cause substantial losses; forecasts and delayed prices can change.
Sources
- [1]Robinhood Q3 2026 financial results — Robinhood Markets · Accessed 2026-10-28T09:07:25.772335-04:00 · Tier 1
- [2]HOOD daily price and volume history — Yahoo Finance · Accessed 2026-10-28T09:08:22.320035-04:00 · Tier 2
- [3]HOOD dated premarket and last-available option metrics — OptionCharts · Accessed 2026-10-28T09:07:25.776344-04:00 · Tier 3
- [4]COIN daily price history — Yahoo Finance · Accessed 2026-10-28T09:08:22.390769-04:00 · Tier 2
- [5]SCHW daily price history — Yahoo Finance · Accessed 2026-10-28T09:08:22.519992-04:00 · Tier 2
- [6]IBKR daily price history — Yahoo Finance · Accessed 2026-10-28T09:08:22.591634-04:00 · Tier 2
- [7]October 2026 Federal Reserve calendar — Federal Reserve · Accessed 2026-10-28T09:08:21.751370-04:00 · Tier 1
- [8]September 16, 2026 FOMC statement — Federal Reserve · Accessed 2026-10-28T09:08:21.795353-04:00 · Tier 1
- [9]Cash-Secured Put — Options Industry Council · Accessed 2026-10-28T09:08:22.077957-04:00 · Tier 1
- [10]Covered Call (Buy/Write) — Options Industry Council · Accessed 2026-10-28T09:08:22.143974-04:00 · Tier 1
- [11]Nasdaq stock market display: archival photo and license — Wikimedia Commons · Accessed 2026-10-28T09:08:22.458954-04:00 · Tier 4
This content is for informational and educational purposes only and is not financial advice. Options involve risk and are not suitable for every investor. Do your own research before trading.
Keep YieldCove close
Choose YieldCove as a preferred source for Top Stories in Google Search.
Run the numbers before you trade: the free wheel strategy calculator sizes the whole cycle, and the cash-secured put calculator shows the cash, return and breakeven of one put.


