
Key takeaways
- Estée Lauder raised its fiscal-2027 outlook after sales rose 7% to US$3.715 billion.
- Fragrance organic sales grew 20%, while adjusted operating margin reached 12.1%.
- Shares surrendered their early gain in the timestamped Monday snapshot below.
- The next company checkpoint is its November 4 China presentation, not another earnings release.
Nov 2, 11:23 EST snapshot
US$108.90
−0.31% vs Oct 30 close
Volume at that snapshot
2,883,678 shares
Partial session, not daily total
Q1 organic sales growth
+6%
Indicative 30-day IV
43.87%
Delayed Cboe snapshot; retrieved 11:23 EST
Next earnings webcast
Feb 3, 2027
8:30 a.m. ET, company calendar
A stronger quarter, a fading share-price rally
Estée Lauder raised its annual forecast on Monday, November 2, after a stronger first quarter ended September 30, 2026. Net sales rose 7% to US$3.715 billion from US$3.481 billion. Reported diluted earnings per share reached US$0.64 versus US$0.13; adjusted EPS, a non-GAAP measure, rose to US$0.72 from US$0.32. That adjusted increase is 125%. [1]
The stock did not simply follow the better results higher. Yahoo Finance’s November 2 snapshot, timestamped 11:23:49 EST, showed US$108.895, down US$0.335, or 0.31%, from Friday’s US$109.23 close. Earlier, it had reached US$113.50, roughly 3.91% above that close. Volume was 2,883,678 shares at the snapshot: an incomplete session, not a closing total or evidence of sustained buying. [6]
EL: 40 completed trading sessions
Unadjusted closes, September 4–October 30, 2026; the November 2 intraday snapshot is not plotted.
Source: Yahoo Finance daily chart API [7]; retrieved November 2, 2026, 11:23 EST. Completed sessions through October 30.
Why fragrance is doing the heavy lifting
Fragrance organic sales jumped 20%, led by luxury brands including Le Labo, TOM FORD, Jo Malone London and KILIAN PARIS. Skin care grew 4% organically and makeup 1%; hair care was flat. Organic growth excludes currency translation and certain other non-comparable items, so it should not be confused with reported sales growth. [1]
- China and travel retail contributed: mainland China organic sales grew 9%, while the Asia/Pacific region grew 10%. Management cited replenishment orders at Beijing and Shanghai airports and improved online Hainan retail sales. [1]
- Procurement savings, manufacturing efficiencies and pricing helped adjusted gross margin reach 75.7%, from 73.3%. Adjusted operating margin rose 4.8 percentage points to 12.1%. [1]
- This was not only a spending retreat: consumer-facing investment increased 8%. The test is whether that support produces durable demand rather than a one-quarter shipment rebound. [1]
| Metric | Latest | Prior comparison |
|---|---|---|
| Quarterly net sales | US$3.715 billion | US$3.481 billion, year earlier |
| Adjusted quarterly EPS | US$0.72 | US$0.32, year earlier |
| FY2027 organic sales growth | 4.0%–5.5% | 3%–5%, August 19 outlook |
| FY2027 adjusted EPS | US$3.20–3.45 | US$3.10–3.35, August 19 outlook |
| FY2027 adjusted operating margin | 12.9%–13.7% | 12.7%–13.5%, August 19 outlook |
| Quarterly free cash flow | −US$235 million | −US$436 million, year earlier |
The new organic-growth midpoint is 4.75%, versus 4% previously. The adjusted-EPS range rose by US$0.10 at both ends; its midpoint increased about 3.10%. That is a meaningful upgrade, but smaller than the quarterly EPS jump. Adjusted figures remove specified items and are not substitutes for the reported accounts. [1]
A higher forecast is not a promise of a higher share price.
Beauty is resilient, but not immune
There is supporting sector evidence, not a blank cheque. L’Oréal reported third-quarter sales of €11.5614 billion, up 7.2% like-for-like, in its October 22 release; it also identified fragrances as a growth driver. Its business mix and growth definitions differ from Estée Lauder’s, so this is context, not a direct scorecard or proof that every beauty company benefits equally. [2]
Household budgets still matter. The latest U.S. CPI release, covering September and published October 14, showed prices up 3.7% over twelve months, before seasonal adjustment, and 0.6% month-on-month seasonally adjusted. That is a consumer-spending headwind to monitor, not an established explanation for EL’s intraday reversal. Price data alone cannot identify the sellers’ motives. [3]
Main risk: recovery is not the same as cash generation
Quarterly free cash flow remained negative US$235 million, although improved from negative US$436 million. Retail replenishment, foreign exchange and economic uncertainty can interrupt the recovery. A more profitable quarter does not remove downside or assignment risk. [1,8]
What it means for option sellers
Cboe’s delayed research snapshot, retrieved November 2 at 11:23 EST, showed indicative 30-day implied volatility of 43.872%, down 10.386 percentage points in the feed’s change field. IV rank was not independently verified. The observation is consistent with post-results volatility compression, but does not establish that any particular option is attractive. These are timestamped research figures, not live premiums; check live prices before trading. [5]
The wheel means potentially buying shares through put assignment, then selling covered calls against shares. A cash-secured put retains substantial stock downside; a covered call limits upside without eliminating downside. Today’s earnings release is already out, but that does not make November expiries event-free. [1,8,9]
Illustration only—not a quoted trade
Suppose a standard 100-share November 20 put had a US$100 strike and a hypothetical US$2 premium. Gross strike collateral would be US$10,000, maximum option profit US$200 and expiry breakeven US$98. At US$80, expiry P/L would be −US$1,800; a zero share price would mean a US$9,800 maximum loss. All figures exclude fees. A hypothetical US$115 covered call would cap the shares’ sale price at US$115, plus its premium—not guarantee recovery. [8,9]
- Calendar check: the November 4 presentation and November 6 U.S. jobs release fall before the illustrative November 20 expiry. [4,10]
- Risk check: an educational review considers bid/ask spreads, open interest, assignment exposure and whether owning the shares would be tolerable; no executable setup is rated here. [8,9]
- Management check: a lower IV reading can reduce an option’s value, all else equal, but an adverse share-price move can outweigh that effect. A premium is not a downside shield. [8,9]
What to watch next
- November 4: Capital Markets Experience presentations from Shanghai, focused on the China growth strategy. [4]
- November 6, 8:30 a.m. ET: October U.S. employment report. November 10, 8:30 a.m. ET: October CPI. Both are scheduled releases, not known outcomes. [10]
- November 30: dividend record date; December 15: US$0.35-per-share payment. The record date is not asserted here to be an ex-dividend date. [1]
- February 3, 2027, 8:30 a.m. ET: next scheduled earnings webcast. Watch cash conversion as well as fragrance growth and margins. [4]
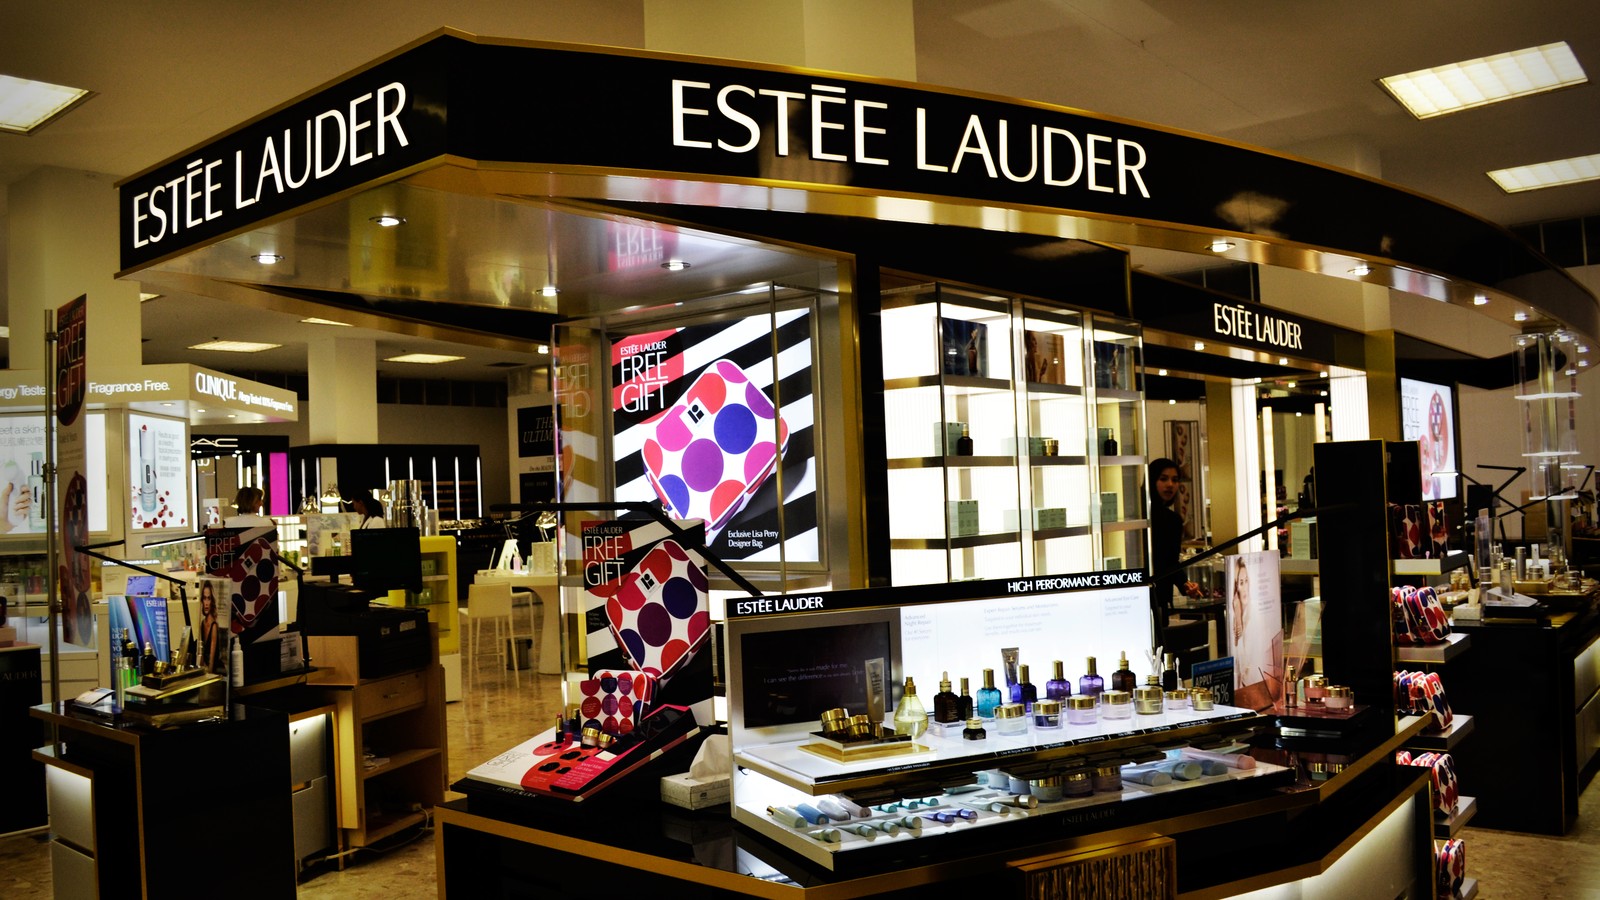
Hero: archival 2015 retail photograph by bargainmoose / bargainmoose.ca via Flickr and Wikimedia Commons, cropped and resized under CC BY 2.0. It does not show today’s earnings event. Source and license: [11,12].
Sources
- [1]Fiscal 2027 first-quarter results, November 2, 2026 — The Estée Lauder Companies · Accessed 2026-11-02T11:23:51.769919-05:00 · Tier 1
- [2]Sales at September 30, 2026; released October 22 — L’Oréal Finance · Accessed 2026-11-02T11:23:51.771151-05:00 · Tier 1
- [3]September 2026 Consumer Price Index; released October 14 — U.S. Bureau of Labor Statistics · Accessed 2026-11-02T11:25:00.978656-05:00 · Tier 1
- [4]Events and presentations calendar — The Estée Lauder Companies · Accessed 2026-11-02T11:23:51.770615-05:00 · Tier 1
- [5]EL delayed quote snapshot and indicative 30-day IV — Cboe · Accessed 2026-11-02T11:23:52.157546-05:00 · Tier 1
- [6]EL intraday price, volume and quote timestamp — Yahoo Finance · Accessed 2026-11-02T11:23:51.775421-05:00 · Tier 3
- [7]EL completed-session daily price history — Yahoo Finance · Accessed 2026-11-02T11:23:51.774728-05:00 · Tier 3
- [8]Cash-secured put: risks, assignment and payoff — Options Industry Council · Accessed 2026-11-02T11:23:51.772967-05:00 · Tier 1
- [9]Covered call: payoff and risks — Options Industry Council · Accessed 2026-11-02T11:23:51.774051-05:00 · Tier 1
- [10]November 2026 economic release schedule — U.S. Bureau of Labor Statistics · Accessed 2026-11-02T11:23:51.772329-05:00 · Tier 1
- [11]Estee Lauder Store in Canada: archival photo by bargainmoose — Wikimedia Commons / Flickr · Accessed 2026-11-02T11:21:47.438474-05:00 · Tier 1
- [12]Creative Commons Attribution 2.0 Generic license — Creative Commons · Accessed 2026-11-02T11:21:47.438474-05:00 · Tier 1
This content is for informational and educational purposes only and is not financial advice. Options involve risk and are not suitable for every investor. Do your own research before trading.
Keep YieldCove close
Choose YieldCove as a preferred source for Top Stories in Google Search.
Run the numbers before you trade: the free wheel strategy calculator sizes the whole cycle, and the cash-secured put calculator shows the cash, return and breakeven of one put.


