
Key takeaways
- GE Vernova raised its outlook and agreed to buy grid supplier Trench for a US$9 billion equivalent.
- Strong power demand did not prevent GEV from lagging infrastructure peers in a dated late-session snapshot.
- Falling implied volatility does not remove assignment or acquisition risk. [1–7]
GEV, Oct 28 at 15:56 ET
US$875.74
−US$19.34 / −2.16%
Partial-session volume
5,157,146 shares
1.94× prior 20 full-session average
30-day implied volatility
49.63%
Down 2.83 percentage points
Q3 revenue
US$12.642 billion
Up 27% year over year
2026 revenue guidance
US$46.5–47.5B
Previously US$45.5–46.5B
Trench agreed price
US$9.0B equivalent
Expected close: late 2027
What happened: stronger business, weaker shares
GE Vernova delivered two big updates on October 28: higher full-year guidance after third-quarter results, and an agreement to acquire high-voltage equipment maker Trench Group. The combination expands a power-and-grid growth story, but also adds a large financing and integration commitment. All dollar amounts below are U.S. dollars. [1,2]
At 15:56:40 ET, Cboe’s delayed GEV snapshot showed $875.74, down $19.34, or 2.16%, from the $895.08 previous close. Volume was 5,157,146 shares. This snapshot was retrieved at 16:13 ET; prices were 15-minute delayed at the time of writing, not live quotes or the final closing print. Check live prices before trading. [4,16]
That volume was 1.94 times the 2,657,885-share average across the previous 20 completed sessions through October 27. Because today’s snapshot stops before the close, this is a comparison with full-day history, not a time-adjusted relative-volume measure. [4,8]
Infrastructure peers: a split late-session reaction
October 28 delayed observations, 15:56–15:58 ET; not final closing returns. Different businesses, not identical exposures. [4–7]
Source: Cboe Global Markets delayed quotes, retrieved October 28, 2026 at 16:13 ET; percent versus previous close. [4–7]
Why the operating outlook improved
For the quarter ended September 30, revenue reached $12.642 billion, up 27%, with 18% organic growth excluding acquisition, disposal and currency effects. GAAP diluted earnings were $4.81 per share. Adjusted EBITDA, a non-GAAP operating-profit measure before interest, taxes, depreciation and amortization with further company adjustments, was $1.943 billion at a 15.4% margin. [1]
Power was the main engine: its orders reached $21.8 billion, up 178% organically, while company-wide orders reached $29.3 billion. GE Vernova’s backlog—remaining performance obligations—rose to $197 billion. Higher equipment demand, pricing and productivity explain the stronger operating results; a large backlog still has to turn into deliveries, margins and cash. [1]
| Measure | Previous outlook | New outlook |
|---|---|---|
| Revenue | US$45.5–46.5B | US$46.5–47.5B |
| Adjusted EBITDA margin | 12–14% | 13.5–14.5% |
| Free cash flow | US$11.5–12.5B | US$16–17B |
| Wind segment EBITDA loss | About US$400M | US$400–500M |
The free-cash-flow midpoint rose from $12 billion to $16.5 billion, a 37.5% increase. Yet the quarter’s $5.409 billion of free cash flow benefited heavily from working capital as well as stronger adjusted EBITDA. Cash arriving earlier is not the same thing as a permanent increase in annual profitability. [1]
Why the grid deal matters—and why peers diverged
Trench makes bushings, instrument transformers and coils used in electrical networks. The agreed $9 billion equivalent price is currently expected to be funded equally with cash and debt. Closing is expected in late 2027, subject to regulatory approvals and required employee consultations; this is an agreement, not a completed acquisition. [2]
GE Vernova describes the price as 13 times Trench’s projected 2028 adjusted EBITDA before synergies. Trench’s projected $1.9 billion revenue and roughly 36% adjusted EBITDA margin are forecasts. The dollar equivalents use a EUR/USD rate of 1.12, so currency changes can alter the eventual dollar cost. [2]
Vertiv provided a separate, upbeat infrastructure signal: third-quarter sales rose 61% to $4.313 billion, and organic orders grew more than 100%. Its shares were up 16.76% in the delayed snapshot, versus gains of 2.41% for Eaton and 3.78% for Amphenol. These different businesses do not prove one common market driver; GEV’s decline cannot be attributed to the acquisition alone. [3,5–7]
The unresolved risk
GEV still expects a $400–500 million Wind EBITDA loss for 2026, versus about $400 million previously. Trench adds financing, approval and integration uncertainty. Strong orders and a higher group outlook do not make every division healthy or establish that the stock is cheap. [1,2]
A bigger backlog is a business opportunity, not a floor under the share price.
What it means for option sellers
Cboe showed 30-day implied volatility of 49.63%, down 2.83 percentage points. IV describes option-implied movement, not a forecast direction; IV rank was not independently verified. This aggregate reading is not the volatility of a particular contract, and lower IV alone does not guarantee a short-option profit when shares fall. [4,11]
For the wheel—selling a cash-secured put, accepting shares if assigned, then potentially writing a covered call—the ownership test remains central. A hypothetical $850 put creates an obligation to buy below the snapshot price; a hypothetical $900 covered call caps share-sale proceeds at that strike if assigned, plus premium. Neither strike is a recommendation or a verified current option quote. [11,12]
Illustrative math, not a quoted trade
Assume a standard 100-share put with an $850 strike and a purely hypothetical $10 premium per share. Cash reserved is $85,000; gross credit is $1,000; expiry breakeven is $840. If shares become worthless, the loss is $84,000 before fees. These are teaching inputs, not an available contract or fill. [11]
- Assignment can turn a small premium into a large stock exposure; a covered call does not eliminate that downside. [11,12]
- GEV reported today. Its issuer calendar lists the fourth-quarter 2026 earnings webcast for January 27, 2027 at 07:30 ET; that is the webcast start, not a confirmed release time. Recheck the issuer schedule before choosing an expiry. [13]
What to watch next
- October 29, 08:30 ET: advance GDP and personal income/PCE inflation releases can change rate-sensitive equity pricing. Outcomes are not known yet. [9,10]
- November 24: the declared $0.50 quarterly dividend is payable to holders of record October 27. That record date has passed; buying now does not establish entitlement. [1]
- Fourth quarter 2026: management expects backlog above $200 billion and at least 130 GW of gas equipment under contract by year-end. Late 2027 remains the expected Trench closing window, not a firm closing date. [1,2]
Risk note: educational market reporting, not personal financial advice. Options can create substantial losses; premiums, assignment timing and actual fees change outcomes. [11,12]
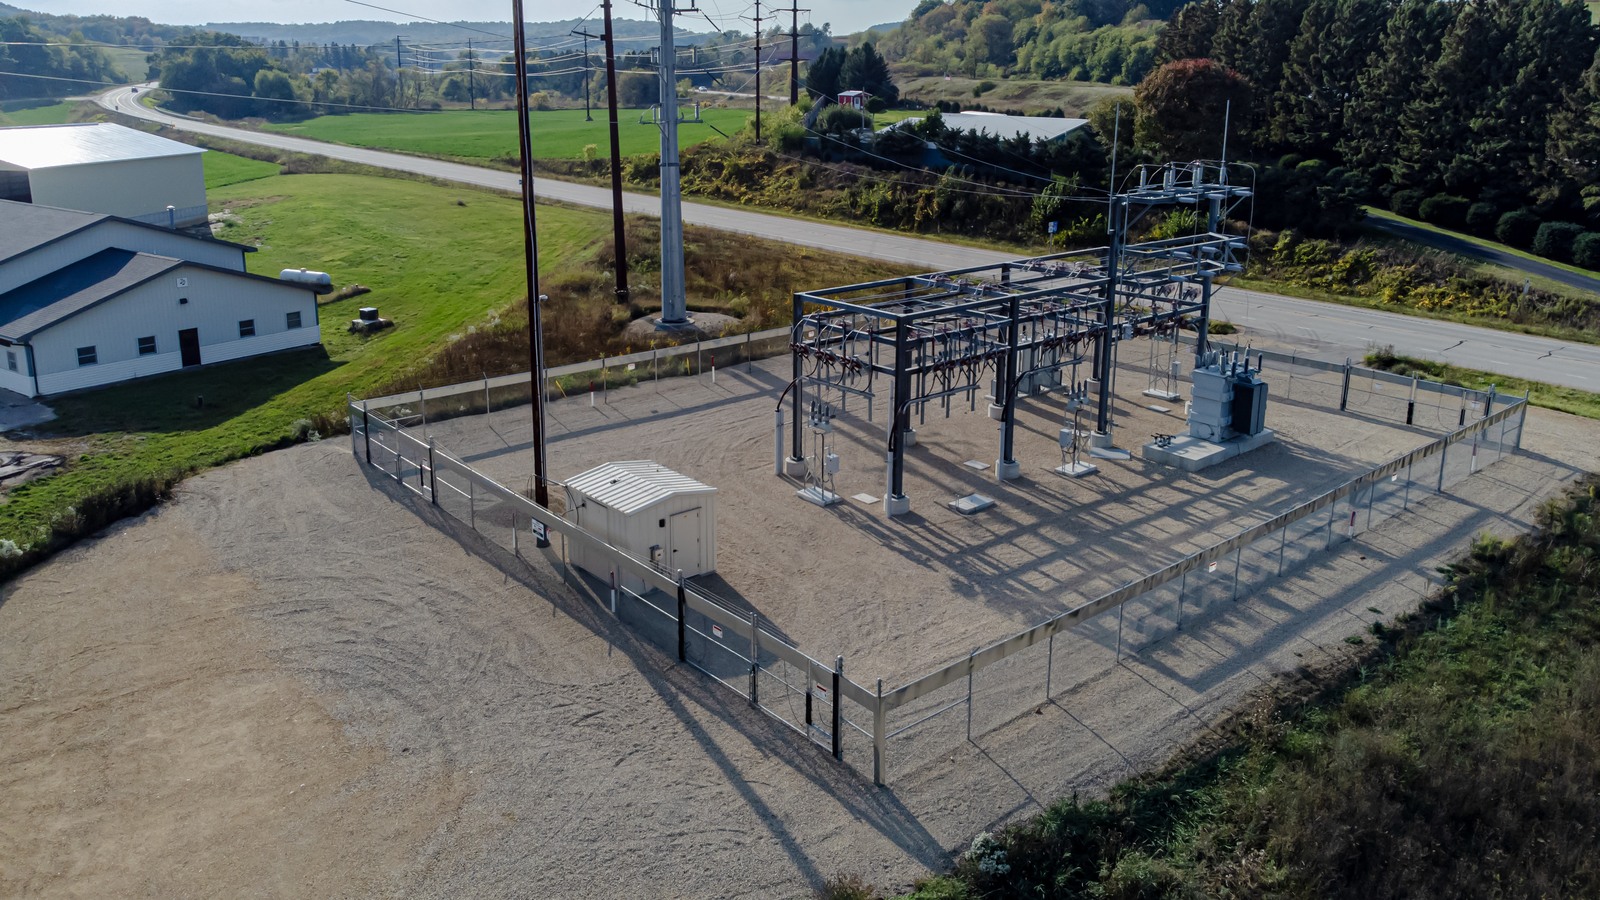
Photo: Wikideas1’s Small electrical substation, October 2023; CC0 1.0, cropped/resized. Illustrative equipment, not identified as GE Vernova or Trench. [14,15]
Sources
- [1]Third-quarter 2026 results and raised full-year guidance — GE Vernova · Accessed 2026-10-28T16:15:55.222238-04:00 · Tier 1
- [2]Agreement to acquire Trench Group, October 28, 2026 — GE Vernova · Accessed 2026-10-28T16:13:45.274824-04:00 · Tier 1
- [3]Third-quarter 2026 results and raised guidance — Vertiv · Accessed 2026-10-28T16:13:45.277036-04:00 · Tier 1
- [4]GEV delayed quote snapshot, October 28, 2026 — Cboe Global Markets · Accessed 2026-10-28T16:13:45.279984-04:00 · Tier 1
- [5]VRT delayed quote snapshot, October 28, 2026 — Cboe Global Markets · Accessed 2026-10-28T16:13:45.726370-04:00 · Tier 1
- [6]ETN delayed quote snapshot, October 28, 2026 — Cboe Global Markets · Accessed 2026-10-28T16:13:45.761209-04:00 · Tier 1
- [7]APH delayed quote snapshot, October 28, 2026 — Cboe Global Markets · Accessed 2026-10-28T16:13:45.803890-04:00 · Tier 1
- [8]GEV daily price and volume history, 20 completed sessions through October 27 — Yahoo Finance · Accessed 2026-10-28T16:14:24.920778-04:00 · Tier 2
- [9]Economic Indicators Calendar, October 2026 — Federal Reserve Bank of New York · Accessed 2026-10-28T16:15:55.223158-04:00 · Tier 1
- [10]Personal Income: next release October 29, 2026 — U.S. Bureau of Economic Analysis · Accessed 2026-10-28T16:15:55.224921-04:00 · Tier 1
- [11]Cash-secured put: assignment, breakeven and loss risks — Options Industry Council · Accessed 2026-10-28T16:13:45.278895-04:00 · Tier 1
- [12]Covered call: capped upside and stock risk — Options Industry Council · Accessed 2026-10-28T16:15:55.223806-04:00 · Tier 1
- [13]Investor relations event calendar, checked October 28 — GE Vernova · Accessed 2026-10-28T16:19:51.895679-04:00 · Tier 1
- [14]Small electrical substation: original photograph and CC0 declaration — Wikimedia Commons / Wikideas1 · Accessed 2026-10-28T16:08:47.708962-04:00 · Tier 4
- [15]CC0 1.0 Universal: public-domain dedication — Creative Commons · Accessed 2026-10-28T16:08:47.299967-04:00 · Tier 1
- [16]GEV delayed-quotes page and data-delay disclosure — Cboe Global Markets · Accessed 2026-10-28T16:15:55.224325-04:00 · Tier 1
This content is for informational and educational purposes only and is not financial advice. Options involve risk and are not suitable for every investor. Do your own research before trading.
Keep YieldCove close
Choose YieldCove as a preferred source for Top Stories in Google Search.
Run the numbers before you trade: the free wheel strategy calculator sizes the whole cycle, and the cash-secured put calculator shows the cash, return and breakeven of one put.


