
Key takeaways
- The Fed held its target at 3.75–4.00%; two officials wanted another quarter-point increase.
- A dated early post-statement snapshot showed small, mixed equity moves—not an all-clear signal.
- Inflation, tomorrow’s economic releases and company earnings still matter for short options. [1,4–10]
Fed target range
3.75–4.00%
Unchanged October 28
Policy vote
10–2
Two officials preferred a hike
SPY, Oct 28 at 14:02 ET
US$770.99
+US$1.33 / +0.17% versus prior close
SPY partial-session volume
10,596,389 shares
Delayed snapshot, not a full session
SPY 30-day implied volatility
13.17%
IV rank not independently verified
September CPI, year over year
3.7%
Released October 14; not new today
The Fed pauses, but the disagreement matters
The Federal Reserve left its federal funds target range at 3.75%–4.00% on October 28, following September’s quarter-percentage-point increase. The decision, released at 2 p.m. EDT, passed 10–2. Lisa Cook and Beth Hammack dissented because they preferred another quarter-point hike, not a cut. September’s increase had passed 12–0. [1,3]
That distinction is the story: an unchanged rate is not the same as a central bank turning easier. The statement describes economic activity as expanding at a strong pace, with resilient domestic spending, robust capital investment and elevated inflation. It promises to use more information to judge the appropriate policy stance; it does not promise a December move. [1]
What the first dated market snapshot showed
At 14:02:12 ET, Cboe’s delayed SPY snapshot showed $770.99, up $1.33, or 0.17%, from the $769.66 previous close. SPY tracks the large-cap S&P 500. Its partial-session volume was 10,596,389 shares. All dollar amounts in this article are U.S. dollars. [5,18]
The snapshot was retrieved at 14:17 ET with a 15-minute delay. It captures an early observation just after the statement, not the later press-conference reaction or today’s final return. Check live prices before trading. A daily percentage move cannot isolate what the Fed alone caused. [5]
The peer picture was restrained: Nasdaq-100 fund QQQ was up 0.18% at 14:02:20 ET, while small-cap fund IWM was down 0.01% at 14:02:14 ET. Technology-heavy growth exposure and smaller companies need not react alike to financing conditions. These observations show different exposures, not proof of a sector-wide causal verdict. [6,7,16,17]
For scale, SPY averaged 39,623,450 shares per full session over the 20 completed sessions ending October 27. Comparing that with today’s incomplete total is not a time-adjusted relative-volume signal. The chart uses those completed sessions and deliberately excludes today’s unfinished bar. [5,8]
SPY: 20 completed sessions before the decision
Unadjusted closing prices, September 30–October 27, 2026. Historical context, not an intraday Fed-reaction chart. [8]
Source: Yahoo Finance daily bars; retrieved October 28, 2026 at 14:17 ET. USD per share. [8]
Why the Fed still has an inflation problem
The latest CPI report, published October 14 for September, showed headline prices rising 0.6% month over month, seasonally adjusted, and 3.7% over 12 months, unadjusted. Gasoline jumped 9.1% in the month and accounted for more than half the headline monthly increase. Those are earlier data informing the backdrop, not figures released today. [4]
Core CPI, excluding food and energy, rose 0.3% in September and 2.6% over the year. That mix helps explain why a pause can coexist with pressure for tighter policy: energy drove much of the latest surge, while officials still have to judge whether inflation spreads. This is context, not a claim that one data point determined each vote. [1,4]
| Measure | Verified figure | Date / meaning |
|---|---|---|
| Federal funds target | 3.75–4.00% | October 28: unchanged |
| Interest on reserve balances | 3.90% | Maintained; effective October 29 |
| Standing repo / reverse repo rates | 4.00% / 3.75% | Implementation effective October 29 |
| Headline CPI | +0.6% monthly / +3.7% yearly | September; monthly adjusted, yearly unadjusted |
| Core CPI | +0.3% monthly / +2.6% yearly | September; monthly adjusted, yearly unadjusted |
A pause removes one decision from the calendar; it does not remove the risk from the option.
What it means for option sellers
Cboe showed SPY’s 30-day implied volatility at 13.169%, rounded to 13.17%, in the same delayed snapshot. A verified IV rank was unavailable, so premiums cannot be labeled historically rich here. Implied volatility describes option pricing, not a guaranteed future move or a probability of profit. [5]
- A fall in implied volatility can help an existing short option, all else equal; an adverse underlying move can overwhelm that benefit. [12,13]
- The wheel still means accepting ownership after put assignment, then potentially selling covered calls. Moving from an option to shares does not eliminate downside. [12,13]
- Company earnings remain separate catalysts. Alphabet schedules its October 28 results call for 4:30 p.m. ET; QQQ holds Alphabet. A quiet Fed snapshot does not settle that earnings risk. [10,16]
Worked illustration—not an observed option quote
Assume a hypothetical November 6 SPY $750 cash-secured put on 100 shares collects $2 per share. Cash reserved is $75,000; maximum option profit is $200; expiry breakeven is $748, before fees and taxes. At $700 at expiry, the loss is $4,800; at zero, $74,800. The assumed premium is not a market offer or a recommendation. [12]
A hypothetical November 6 $790 covered call illustrates the other side: the shareholder receives a premium but can lose further upside above the strike if assigned. The underlying can still fall sharply. These are educational strikes, not rated setups; actual contract terms, spreads and prices must be checked. [13]
The main risk
Selling an option just because the rate decision is over can leave the seller exposed to the next inflation surprise or earnings gap. A lower strike is not a floor, and rolling a position does not erase a loss. [9,10,12,13]
What to watch next
- October 28, 4:30 p.m. ET: Alphabet’s Q3 results call; examine the actual release rather than assuming an outcome. [10]
- October 29, 8:30 a.m. ET: BEA schedules advance Q3 GDP and September Personal Income and Outlays. Growth and inflation details can change the policy debate. [9]
- December 8–9: the next scheduled FOMC meeting; the decision day is December 9. No next-rate outcome is established by today’s hold. [11]
For option sellers, the useful question is what risk remains during the contract’s life—not whether the latest headline sounds reassuring. This is general education, not personal financial advice.
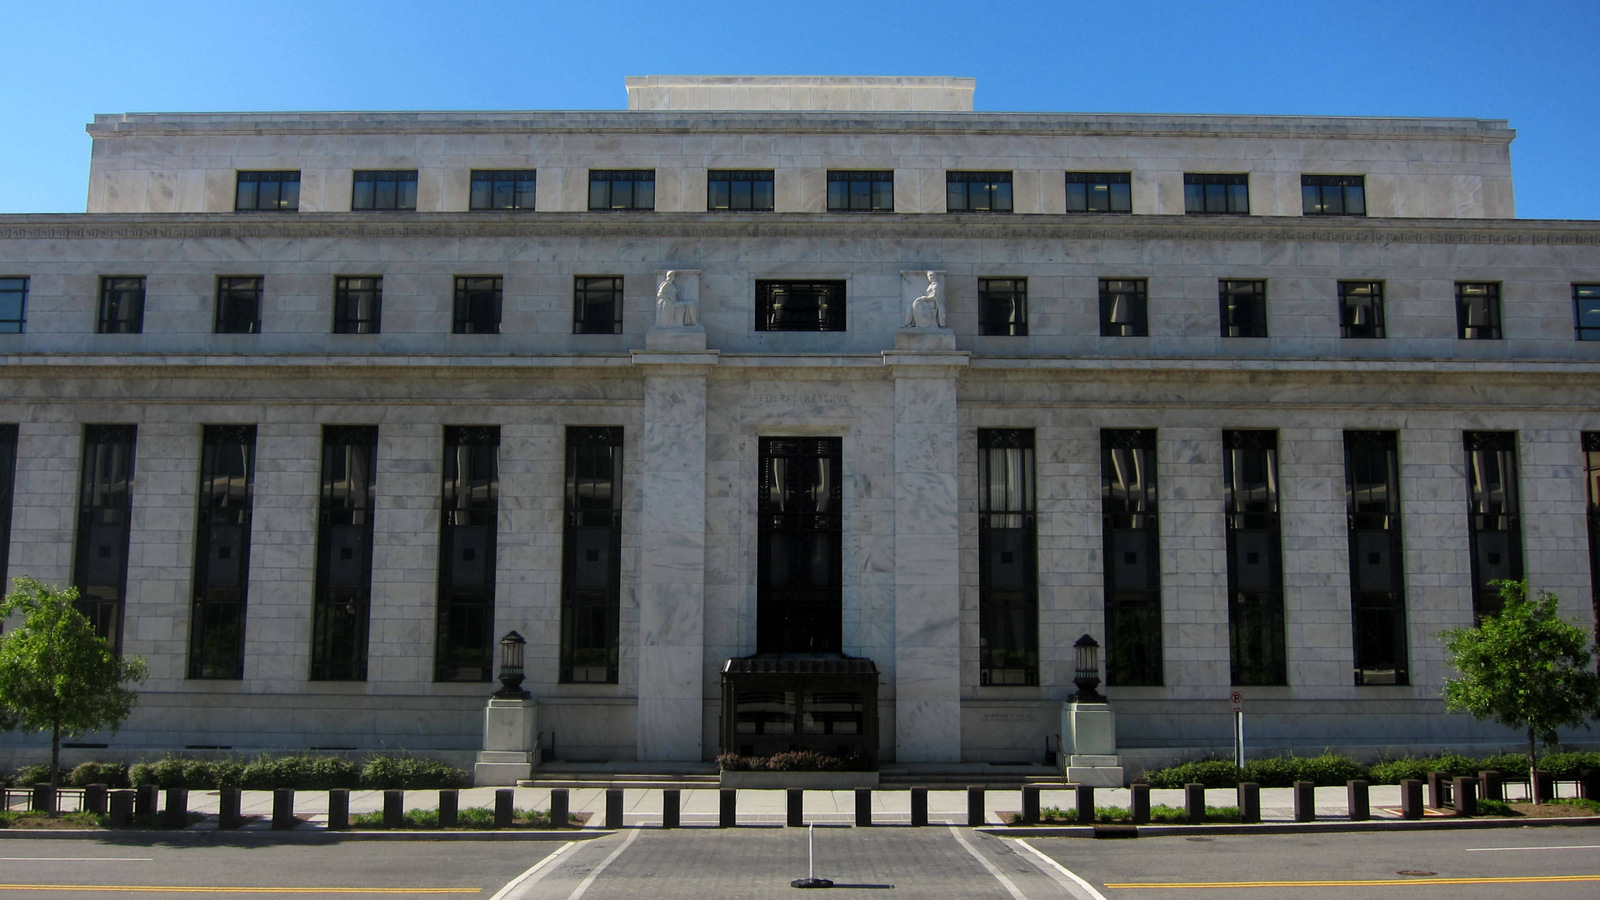
Archival photo: AgnosticPreachersKid, “Eccles Building - north side”, May 10, 2010—not today’s meeting. Cropped/resized; the adapted photograph is licensed CC BY-SA 3.0. [14,15]
Sources
- [1]October 28, 2026 FOMC statement — Federal Reserve · Accessed 2026-10-28T14:17:45.201207-04:00 · Tier 1
- [2]October 28 implementation note; effective October 29 — Federal Reserve · Accessed 2026-10-28T14:17:45.202101-04:00 · Tier 1
- [3]September 16, 2026 FOMC statement — Federal Reserve · Accessed 2026-10-28T14:17:45.517715-04:00 · Tier 1
- [4]September 2026 CPI, released October 14 — Bureau of Labor Statistics · Accessed 2026-10-28T14:19:35.777624-04:00 · Tier 1
- [5]SPY delayed snapshot: price, volume and 30-day IV — Cboe Global Markets · Accessed 2026-10-28T14:17:48.778277-04:00 · Tier 1
- [6]QQQ delayed snapshot — Cboe Global Markets · Accessed 2026-10-28T14:17:48.213055-04:00 · Tier 1
- [7]IWM delayed snapshot — Cboe Global Markets · Accessed 2026-10-28T14:17:46.759928-04:00 · Tier 1
- [8]SPY unadjusted daily closing prices and volume — Yahoo Finance · Accessed 2026-10-28T14:17:45.566589-04:00 · Tier 2
- [9]Economic release schedule: October 29 GDP and income/outlays — Bureau of Economic Analysis · Accessed 2026-10-28T14:17:45.203752-04:00 · Tier 1
- [10]Alphabet Q3 2026 earnings-call date announcement — Alphabet · Accessed 2026-10-28T14:18:47.248506-04:00 · Tier 1
- [11]2026 FOMC meeting calendar — Federal Reserve · Accessed 2026-10-28T14:17:45.202649-04:00 · Tier 1
- [12]Cash-secured put: mechanics, volatility and loss risk — Options Industry Council / OCC · Accessed 2026-10-28T14:17:45.204332-04:00 · Tier 1
- [13]Covered call: mechanics, assignment and capped upside — Options Industry Council / OCC · Accessed 2026-10-28T14:17:45.204977-04:00 · Tier 1
- [14]Eccles Building - north side — supplied title, author, date and license — Wikimedia Commons / AgnosticPreachersKid · Accessed 2026-10-28T14:12:39.678060-04:00 · Tier 4
- [15]Creative Commons Attribution-ShareAlike 3.0 Unported — Creative Commons · Accessed 2026-10-28T14:12:39.558344-04:00 · Tier 1
- [16]QQQ: Nasdaq-100 objective, sectors and holdings — Invesco · Accessed 2026-10-28T14:19:48.905011-04:00 · Tier 1
- [17]IWM: Russell 2000 and U.S. small-cap exposure — iShares / BlackRock · Accessed 2026-10-28T14:19:48.870008-04:00 · Tier 1
- [18]SPY: S&P 500 large-cap fund objective; no stale NAV used — State Street Investment Management · Accessed 2026-10-28T14:19:48.882009-04:00 · Tier 1
This content is for informational and educational purposes only and is not financial advice. Options involve risk and are not suitable for every investor. Do your own research before trading.
Keep YieldCove close
Choose YieldCove as a preferred source for Top Stories in Google Search.
Run the numbers before you trade: the free wheel strategy calculator sizes the whole cycle, and the cash-secured put calculator shows the cash, return and breakeven of one put.


