
Key takeaways
- Intel’s server business grew 78%, but its fourth-quarter outlook points to lower revenue and margins. [1]
- A 19:09 ET after-hours observation put the shares 23.40% below their regular close; it is not a live quote. [3][4]
- Management identified both softer PC demand and a factory disruption. [2]
- For option sellers, a lower share price is not protection against another gap. [10]
INTC, Oct 29 at 19:09:29 ET
US$70.53
−23.40% versus regular close [4]
Regular-session close
US$92.07
−US$3.46 / −3.62% [3]
Yahoo daily share-volume count
112,052,896
1.16× prior-20-session mean [3]
Q3 Data Center and AI revenue
US$7.3B
+78% year over year [1]
Q4 adjusted gross-margin outlook
38.0%
6.1 percentage points below Q3 [1]
What happened after the close
Intel released third-quarter results on October 29, then delivered a fourth-quarter forecast that explains why fast AI growth is not the whole story. Yahoo Finance’s saved intraday snapshot showed US$70.53 at 19:09:29 ET, down US$21.54, or 23.40%, from the regular close. That is a timestamped extended-hours observation, not an executable price or a prediction for Friday. All dollar amounts here are U.S. dollars. [1][3][4]
The stock had already closed at $92.07, down $3.46, or 3.62%, from October 28’s $95.53. Yahoo’s daily snapshot counted 112,052,896 shares, about 1.16 times the preceding 20-session mean of 96,840,085. That earlier decline came before the earnings release. The chart below deliberately excludes extended-hours prices, so it does not show the full post-report selloff. [1][3]
INTC: 20 regular-session closes
October 2–29, 2026. Unadjusted closes, rounded to cents; excludes extended-hours trading. [3]
Source: Yahoo Finance daily-history endpoint, retrieved October 29, 2026 at 19:10 ET. [3]
Why the outlook outweighed server growth
For the quarter ended September 26, revenue reached $16.513 billion, up a reported 21% year over year. Adjusted diluted earnings were $0.52 a share, while GAAP diluted earnings were $0.60. These are different accounting measures, not interchangeable versions of the same profit figure. Operating cash flow was $5.1 billion, but the immediate problem was what came next. [1]
| Measure | Q3 2026 reported | Q4 2026 outlook |
|---|---|---|
| Revenue | $16.513B | $15.0B–$16.0B |
| GAAP diluted EPS | $0.60 | $0.10 |
| Adjusted diluted EPS | $0.52 | $0.25 |
| GAAP gross margin | 43.0% | 37.1% |
| Adjusted gross margin | 44.1% | 38.0% |
The revenue outlook’s $15.5 billion midpoint is about 6.13% below the reported third quarter. More strikingly, adjusted gross margin is forecast to fall 6.1 percentage points. Intel’s prepared remarks attribute that pressure primarily to lower overall revenue against fixed costs, alongside revenue mix. Strong demand cannot become sales unless manufacturing and packaging capacity can deliver the chips. [1][2]
The split inside the company is sharp: Data Center and AI revenue rose 78% to $7.3 billion, while Client Computing and Physical AI revenue fell 5% to $8.1 billion. Management described higher memory prices, availability constraints and limited IT budgets hurting PC demand. Its release said the PC slowdown could continue at least through the first half of 2027; that is management’s outlook, not an established outcome. [1][2]
- Manufacturing: the prepared remarks estimate the Fab 28 incident’s Q4 impact at roughly $300 million of revenue and 200 basis points of gross margin. These are early estimates. [2]
- PC demand: management expects client-group revenue to decline more than 20% sequentially in Q4. [2]
- Sector context: AMD closed down 2.08% and Nvidia down 0.80% on October 29, before Intel reported. Those moves are not evidence that Intel caused their regular-session declines. [5][6]
Fast server growth does not turn a weak margin outlook into a floor under the stock.
What it means for option sellers
For a wheel strategy, the question is no longer simply whether Intel can grow server sales. It is whether an investor could accept owning the shares through weaker PC demand and manufacturing uncertainty. A cash-secured put creates an obligation to buy at its strike if assigned, even when the market price has fallen far below it. The option premium only cushions part of that loss. [1][2][10]
The main risk: a second repricing
The earnings announcement has happened, but its consequences have not finished unfolding. Assignment risk remains, and a covered call still leaves the owner exposed to falling shares. A premium is not insurance against the company’s operating problems. [10][11]
Current post-report implied volatility and IV rank were not independently confirmed for this article. The stock-price snapshot is not a substitute for those option-chain measurements. Before evaluating any sale at the next regular session, the relevant inputs are a fresh option chain, bid/ask spread, available volume and open interest—not a pre-earnings premium.
Hypothetical math—not a quoted trade
For illustration only, assume a standard 100-share $65 put and an invented $1.00-per-share credit. Gross purchase cash is $6,500, credit is $100 and expiry breakeven is $64 before fees. If shares finish at $55, the position loses $900 at expiry. No expiry, current premium or probability is being offered. [10]
Likewise, an illustrative $80 covered-call strike would cap the share sale price at $80 if assigned, with the premium added separately. It would not erase the downside of the shares. These strike examples explain the obligations; they are not recommended contracts, support levels or instructions to enter a position. [11]
What to watch next
The next checks combine company-specific evidence with scheduled market events. The Fed held its target range at 3.75%–4.00% on October 28, so fresh inflation-related information remains relevant context—not a proven cause of Intel’s evening move. [8]
| Date | Event | Why it matters |
|---|---|---|
| October 30, 08:30 ET | Q3 Employment Cost Index | A scheduled wage-cost update; no result assumed. [9] |
| November 3, after market close | AMD Q3 results | A peer checkpoint for the demand discussion. [7] |
| November 3, 17:00 ET | AMD earnings call | Listen for differences in PC and server demand. [7] |
- Watch for revised information about Fab 28 and available server supply; no reopening date is assumed here. [2]
- Separate PC weakness from server demand rather than treating every semiconductor business as the same exposure. [1][2]
- Treat Q4 revenue and margin targets as checkpoints to test, not promises of a recovery. [1]
The practical distinction is between a lower price and a lower risk. Intel has demonstrated server growth, but its own outlook also describes shrinking client demand and near-term supply damage. An option seller collecting income would still be accepting those business risks. [1][2][10]
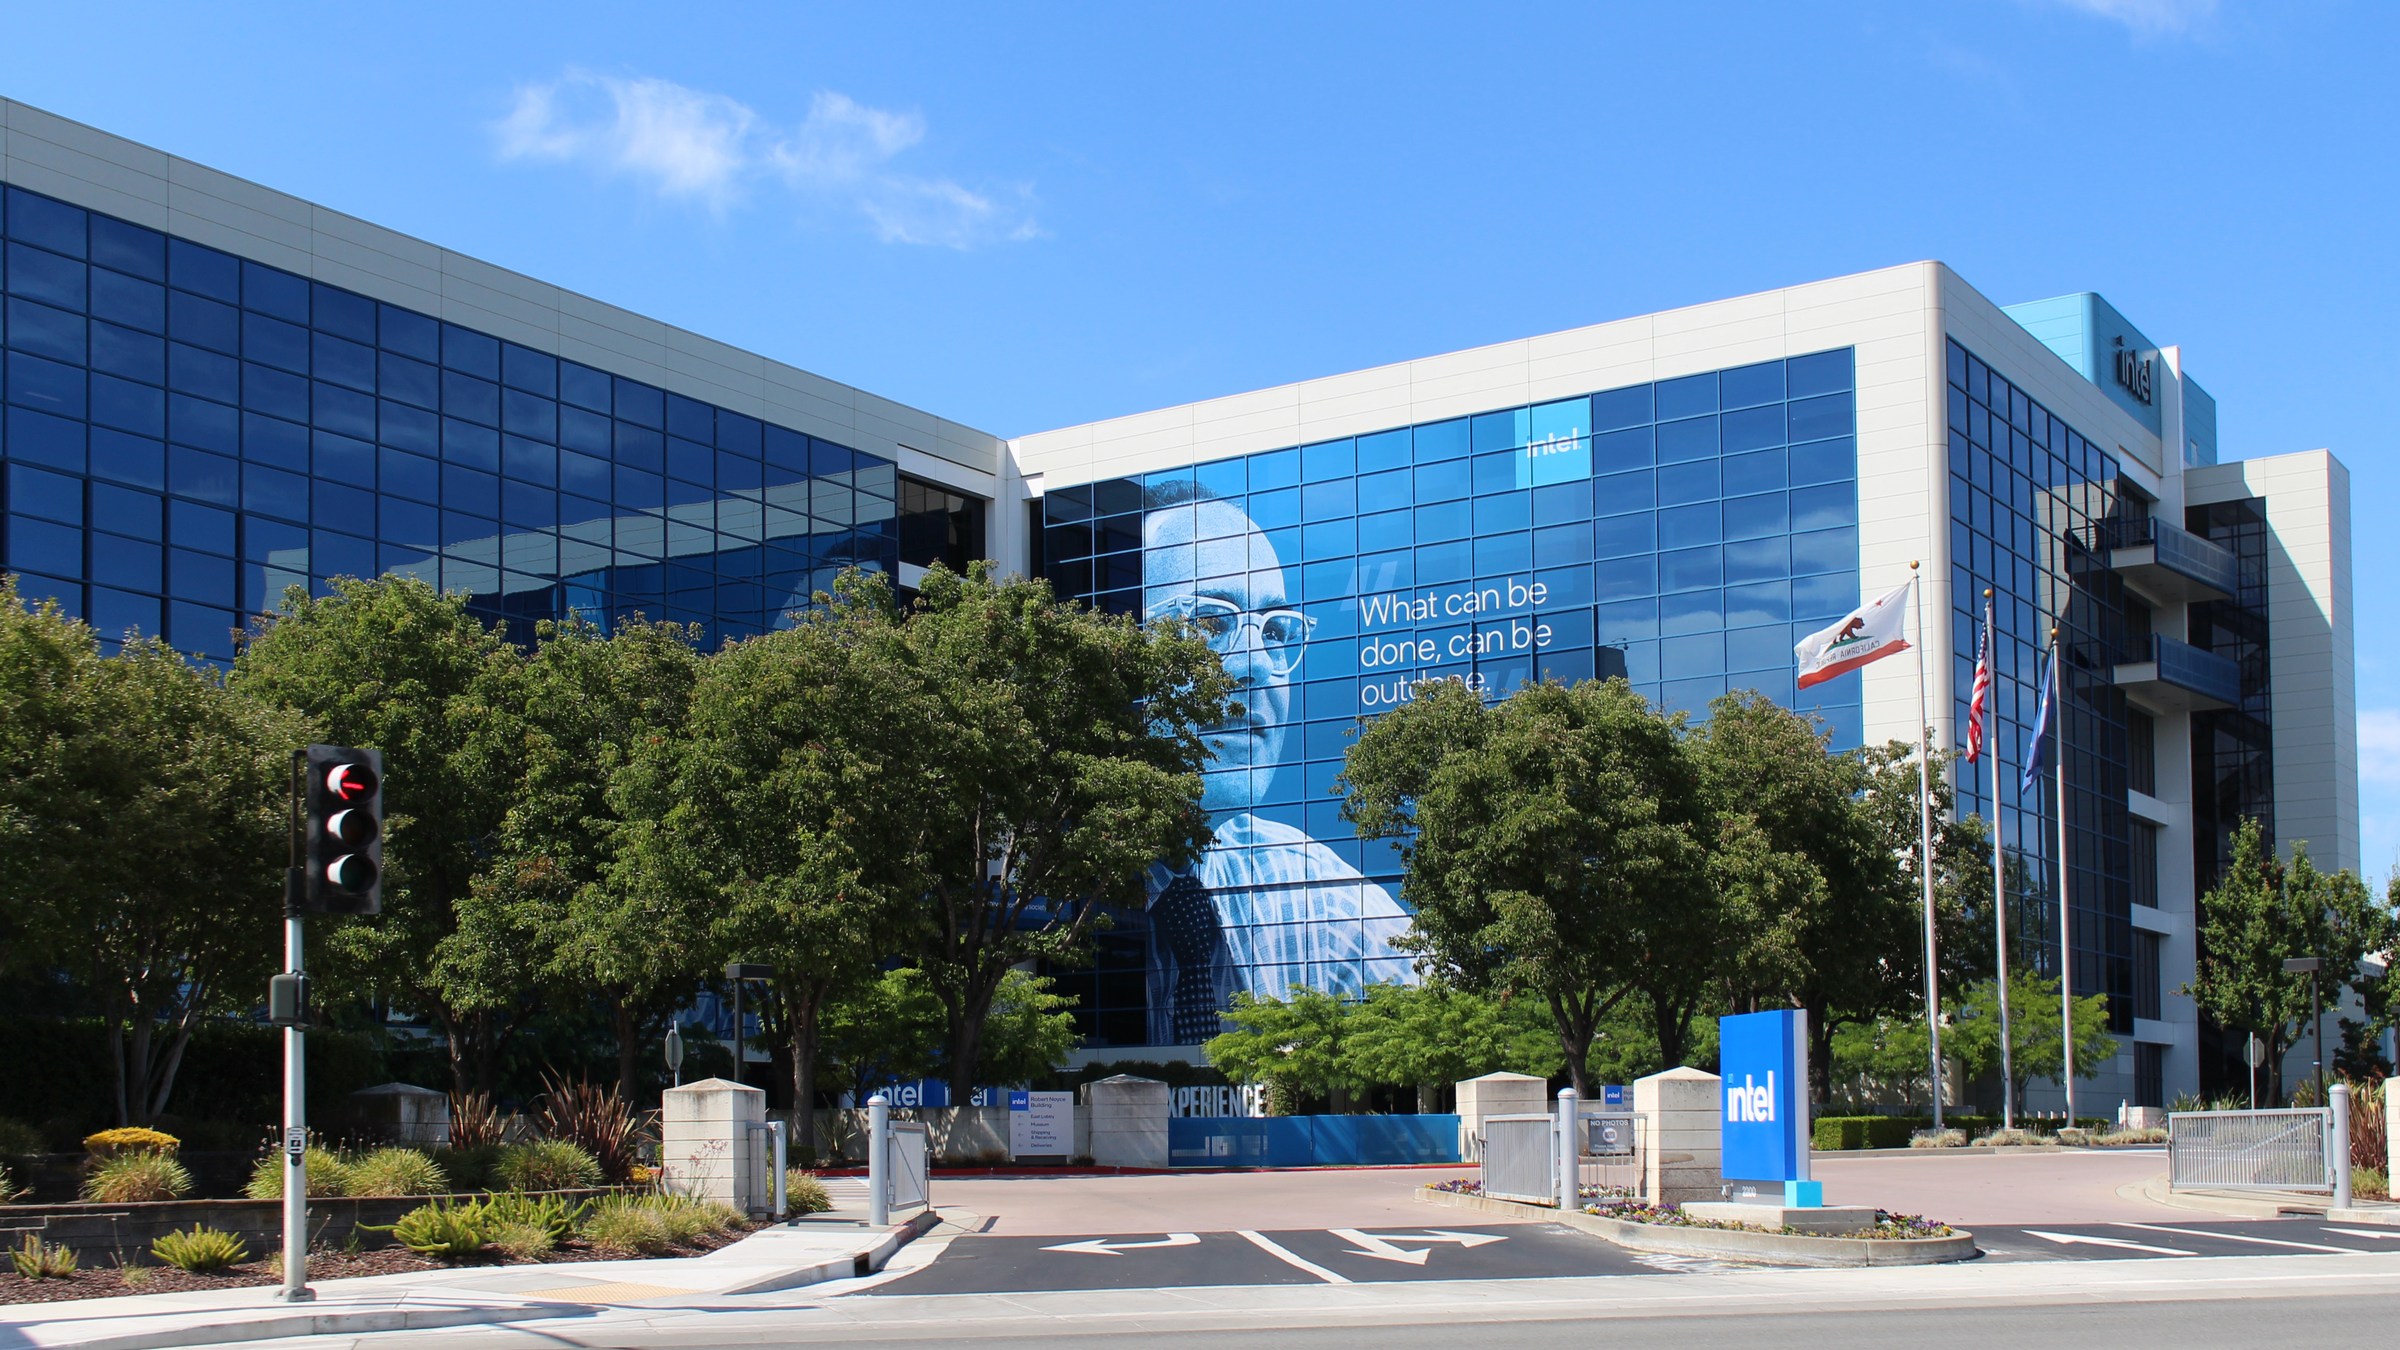
Hero: archival July 2, 2023 photograph by Coolcaesar / Wikimedia Commons. Cropped and resized; adapted photograph licensed CC BY-SA 4.0. It is not an image of this earnings event. [12][13]
Sources
- [1]Q3 2026 results and Q4 outlook — Intel · Accessed 2026-10-29T19:12:43.883928-04:00 · Tier 1
- [2]Q3 2026 CEO/CFO prepared remarks — Intel · Accessed 2026-10-29T19:15:57.509609-04:00 · Tier 1
- [3]INTC daily history, October 29 snapshot — Yahoo Finance · Accessed 2026-10-29T19:10:51.911920-04:00 · Tier 3
- [4]INTC extended-hours intraday snapshot — Yahoo Finance · Accessed 2026-10-29T19:10:51.941685-04:00 · Tier 3
- [5]AMD daily history, October 29 snapshot — Yahoo Finance · Accessed 2026-10-29T19:10:52.020274-04:00 · Tier 3
- [6]NVDA daily history, October 29 snapshot — Yahoo Finance · Accessed 2026-10-29T19:10:52.059742-04:00 · Tier 3
- [7]AMD Q3 results and call schedule — AMD Investor Relations · Accessed 2026-10-29T19:10:51.511668-04:00 · Tier 1
- [8]FOMC statement, October 28, 2026 — Federal Reserve · Accessed 2026-10-29T19:10:51.512354-04:00 · Tier 1
- [9]Employment Cost Index release schedule — U.S. Bureau of Labor Statistics · Accessed 2026-10-29T19:20:03.895562-04:00 · Tier 1
- [10]Cash-secured put: obligations and risks — OCC Options Industry Council · Accessed 2026-10-29T19:10:51.514222-04:00 · Tier 1
- [11]Covered call: obligations and risks — OCC Options Industry Council · Accessed 2026-10-29T19:12:43.884833-04:00 · Tier 1
- [12]Intel Headquarters in 2023: original photograph and attribution — Wikimedia Commons / Coolcaesar · Accessed 2026-10-29T19:10:51.861367-04:00 · Tier 1
- [13]CC BY-SA 4.0: licence terms — Creative Commons · Accessed 2026-10-29T19:12:43.886531-04:00 · Tier 1
This content is for informational and educational purposes only and is not financial advice. Options involve risk and are not suitable for every investor. Do your own research before trading.
Keep YieldCove close
Choose YieldCove as a preferred source for Top Stories in Google Search.
Run the numbers before you trade: the free wheel strategy calculator sizes the whole cycle, and the cash-secured put calculator shows the cash, return and breakeven of one put.


