
Key takeaways
- Amazon finished Friday 4.79% above its session low, but still fell 1.41% from Thursday.
- Heavy volume shows a busy repricing session, not proof that a bottom is in.
- Post-earnings option selling still carries stock, assignment and macro risks.
October 30 close
US$240.35
−US$3.44 / −1.41%
Low-to-close recovery
+4.79%
From US$229.36
Daily-history share volume
104.78 million
2.75× prior 20-session average
Q3 operating margin
13.9%
Company-reported record
Nov. 2 US$240 call IV
36.52%
Last-session delayed snapshot; not IV rank
What happened: a recovery, not a clean reversal
Amazon’s first full session after Thursday’s results ended better than its opening suggested. On Friday, October 30, shares opened at US$232.54, touched US$229.36 and closed at US$240.35. That was 3.36% above the open and 4.79% above the day’s low, yet still US$3.44, or 1.41%, below Thursday’s US$243.79 close. These are completed-session figures, not Saturday trading prices. [1]
Yahoo’s daily-history table recorded 104,775,800 shares, roughly 2.75 times the preceding 20-session average of 38,110,095. The day’s high was US$241.55, still below the previous close. Those landmarks show a partial recovery within a down day; daily open-high-low-close data cannot identify exactly when buyers stepped in or prove why they did. [1]
Why the market had two stories to price
The October 29 report supplied a genuine operating improvement: third-quarter revenue rose 12% to US$201.9 billion and operating income reached US$28.1 billion, versus US$17.4 billion a year earlier. Amazon reported a record 13.9% operating margin. AWS sales grew 39.3% to about US$46.0 billion, giving investors evidence that cloud demand was converting into revenue, not just a spending plan. [2]
Cash generation told a less comfortable story. Trailing-12-month operating cash flow was US$168.3 billion, but free cash flow was a US$42.4 billion outflow as infrastructure investment absorbed cash. Management still expected approximately US$220 billion of 2026 cash capital expenditures. These disclosures help explain the growth-versus-investment debate; they do not establish a single cause for every move in Friday’s share price. [2]
Cloud rivals were also lower: Microsoft lost 1.55% to US$521.91 and Alphabet’s Class A shares fell 1.40% to US$279.84. Their similar closing declines put Amazon’s move in sector context, without showing that their businesses or earnings risks are identical. The comparison also cautions against treating Amazon’s rebound from its low as broad sector strength. [3,4]
- Operating strength: revenue and margins improved. [2]
- Cash demands: infrastructure spending absorbed operating cash. [2]
- Sector context: Microsoft and Alphabet also declined. [3,4]
Cloud peers ended Friday lower
October 30, 2026 close-to-close change (%); zero reference anchors axis.
Source: Yahoo Finance daily historical prices [1,3,4]; October 30, 2026 session, retrieved October 31 at 14:21 ET.
The holiday-quarter execution test
| Measure | Figure | Period / meaning |
|---|---|---|
| Diluted EPS | US$1.89 versus US$1.95 | Q3 2026 versus Q3 2025 |
| Revenue outlook | US$240.0–US$247.0 billion | Q4 2026 guidance |
| Operating-income outlook | US$28.5–US$33.5 billion | Q4 2026 guidance |
| Advertising outlook | High-teens year-over-year growth | Q4 management expectation |
The midpoint of the sales range is US$243.5 billion; the operating-income midpoint is US$31.0 billion. These are useful reference points for the holiday quarter, not promises. Amazon also said Prime Day moved into Q2 in most large countries, making the Q3 year-over-year sales comparison less straightforward. Calendar effects should not be confused with a permanent change in customer demand. [2]
The consumer backdrop needs similar care. BEA’s October 29 release showed September nominal consumer spending up 0.5% from August, while real spending rose less than 0.1%. The PCE price index was up 3.6% year over year, or 3.1% excluding food and energy. Higher dollar spending therefore does not automatically mean equally stronger shopping volumes, and national data do not directly forecast Amazon’s sales. [5]
What it means for option sellers
Yahoo’s last-session snapshot showed 36.52% implied volatility on the November 2 US$240 call, with a listed last trade at 3:59 p.m. ET on October 30. Prices were 15-minute delayed at the time of writing, from the last completed session. This is one contract’s IV, not IV rank; a comparable current IV rank was not verified. Check live prices before trading. [6]
The Options Industry Council explains that IV often falls after earnings uncertainty clears. That is a general mechanism, not proof of Amazon’s actual before-and-after IV change here. The latest earnings event is past, but the next Amazon reporting date was not established in the checked release. Longer expiries still require a fresh calendar check rather than an assumption that earnings risk has disappeared. [2,7]
Educational strike math—not a recommendation
Assume a standard 100-share contract. An illustrative US$220 cash-secured put represents US$22,000 of strike cash before fees; expiration breakeven is US$220 minus premium per share. An illustrative US$250 covered call can require selling 100 shares for US$25,000 if assigned. No premium, fill or profitability is assumed. [8,9]
A rebound is not downside protection
A put can turn into shares after another drop, while a covered call caps upside but leaves substantial stock downside. Friday’s low is an observed price, not a guaranteed floor. These strike examples are not screened trade setups or personal advice. [1,8,9]
- Reassessment: rebuild quotes and spreads after reopening; Friday’s snapshot is not a standing offer. [6]
- Business risk: monitor cash investment against operating progress, not AWS growth alone. [2]
- Calendar risk: distinguish the November 2 contract snapshot from later labor-data releases. [6,10]
An educational review plan
- Refresh the event calendar before considering any new expiry. [2,10]
- Reassess assignment obligations and share exposure, not premium income alone. [8,9]
Recovering from the day’s low is not the same as recovering the investment case.
What to watch next
| Date | Release | Why it matters |
|---|---|---|
| November 3, 10 a.m. | September JOLTS | Labor-demand context |
| November 6, 8:30 a.m. | October Employment Situation | Macro risk for that expiry week |
| November 25, 8:30 a.m. | October Personal Income and Outlays | Consumer spending and inflation update |
The next useful test is whether Amazon can sustain operating progress while delivering its holiday outlook and funding expansion. Friday’s recovery narrows the day’s loss; it does not resolve that question. The dated labor and spending releases add separate market-wide checkpoints, so a fresh options review needs both company evidence and the wider calendar. [1,2,5,10]
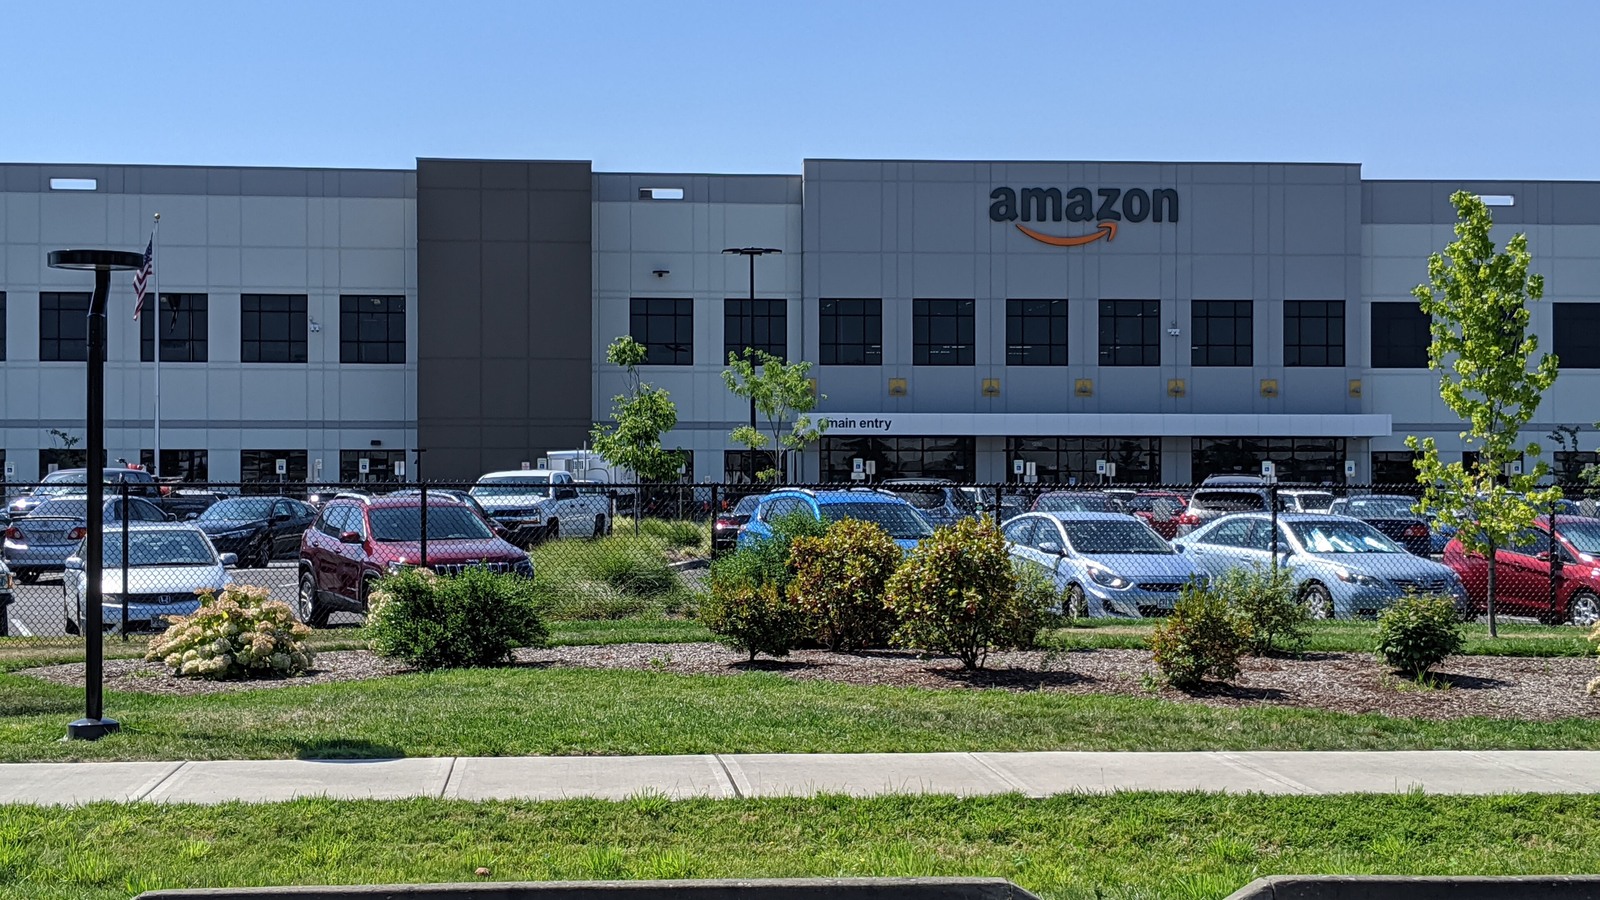
Hero: archival July 2020 photograph of Amazon’s Troutdale, Oregon fulfillment center by Tedder; cropped and resized. The adapted photo remains under CC BY-SA 4.0, with the source and license linked below. It does not show current operations. [11,12]
Sources
- [1]Amazon daily historical prices — Yahoo Finance · Accessed 2026-10-31T14:21:51.795287-04:00 · Tier 3
- [2]Amazon third-quarter 2026 results — Amazon · Accessed 2026-10-31T14:21:51.795876-04:00 · Tier 1
- [3]Microsoft daily historical prices — Yahoo Finance · Accessed 2026-10-31T14:21:51.796175-04:00 · Tier 3
- [4]Alphabet daily historical prices — Yahoo Finance · Accessed 2026-10-31T14:21:51.796791-04:00 · Tier 3
- [5]Personal Income and Outlays, September 2026 — U.S. Bureau of Economic Analysis · Accessed 2026-10-31T14:21:51.797071-04:00 · Tier 1
- [6]Amazon delayed options snapshot — Yahoo Finance · Accessed 2026-10-31T18:23:10.128914+00:00 · Tier 3
- [7]The Crush Is Real — Options Industry Council · Accessed 2026-10-31T14:21:52.112859-04:00 · Tier 1
- [8]Cash-Secured Put — Options Industry Council · Accessed 2026-10-31T14:21:52.441389-04:00 · Tier 1
- [9]Covered Call (Buy/Write) — Options Industry Council · Accessed 2026-10-31T14:21:52.638364-04:00 · Tier 1
- [10]November 2026 release calendar — U.S. Bureau of Labor Statistics · Accessed 2026-10-31T14:48:03.935756-04:00 · Tier 1
- [11]Amazon fulfillment center in Troutdale, Oregon — Wikimedia Commons / Tedder · Accessed 2026-10-31T14:21:52.699075-04:00 · Tier 4
- [12]Creative Commons Attribution-ShareAlike 4.0 — Creative Commons · Accessed 2026-10-31T14:21:52.735556-04:00 · Tier 1
This content is for informational and educational purposes only and is not financial advice. Options involve risk and are not suitable for every investor. Do your own research before trading.
Keep YieldCove close
Choose YieldCove as a preferred source for Top Stories in Google Search.
Run the numbers before you trade: the free wheel strategy calculator sizes the whole cycle, and the cash-secured put calculator shows the cash, return and breakeven of one put.


