
Key takeaways
- AMD fell 10.88% on Friday as PC-demand concerns spread through chip stocks. [14]
- Its own November 3 report will test a different mix: strong data-center growth alongside PC exposure.
- A cheaper share price does not remove earnings-gap or assignment risk.
October 30 close
US$504.80
−US$61.62 / −10.88%
Daily-history volume
39.59 million
2.03× prior 20-session average
Q3 revenue guidance
US$12.7–13.3B
August 4 outlook, not results
Next earnings
November 3
After close; call 5 p.m. Eastern
Nov. 2 US$505 call IV
54.35%
Oct. 30 delayed snapshot; not IV rank [5]
What happened: a PC warning hits AMD
AMD enters the weekend facing two competing stories: a sharp sell-off and a still-unresolved growth test. Shares closed Friday, October 30, at US$504.80, down US$61.62, or 10.88%, from Thursday’s US$566.42. The daily-history table records a US$492.21–US$520.40 trading range. These are completed-session prices, not live Saturday quotes. [1]
Yahoo’s daily-history volume was 39,589,800 shares, about 2.03 times the preceding 20-session average of 19,517,135. That comparison uses the same historical table rather than mixing its final volume with a different quote-page counter. Heavy turnover shows that repricing was busy; it does not establish who was selling or prove that the decline has finished. [1]
AMD: October closing prices
22 completed sessions, October 1–30, 2026. The axis is a price scale, not a return forecast.
Source: Yahoo Finance daily historical prices [1], October 1–30, 2026; retrieved October 31 at 16:22 ET.
Why it happened: PCs are not the whole business
Intel’s October 29 report supplied a concrete reason for caution. It forecast fourth-quarter revenue of US$15.0–16.0 billion after reporting US$16.5 billion in Q3. Finance chief David Zinsner expected the PC slowdown to continue at least through the first half of 2027. This is Intel’s outlook, not evidence that AMD has already missed its own targets. [2]
The pressure extended beyond AMD: Intel closed down 28.58% and Nvidia lost 4.22% on October 30. Those declines support a semiconductor-sector explanation, but they do not isolate a single cause for AMD’s move. Different product mixes, spending needs and expectations mean that a competitor’s warning is a useful question for management, not a substitute for AMD’s results. [12,13]
AMD’s last reported quarter showed why the comparison needs care: Q2 revenue was US$11.536 billion, up 50% year over year. Data Center generated US$6.7 billion, up 107%, and represented 58% of company revenue. Client revenue was US$3.1 billion, up 23%. The PC business matters, but the larger data-center engine gives Tuesday’s report a separate set of tests. [3]
| Measure | Figure | Period / basis |
|---|---|---|
| Revenue | US$11.536B | Q2 2026 actual |
| Diluted EPS | US$1.38 / US$1.66 | Q2 GAAP / non-GAAP |
| Revenue outlook | US$13.0B ± US$0.3B | Q3 2026 guidance |
| Gross-margin outlook | About 56% | Q3 non-GAAP guidance |
The revenue midpoint implies 12.69% growth from Q2, while AMD’s release described the year-over-year increase as approximately 41%. Investors can compare Tuesday’s actual sales and margins with those published benchmarks, then examine the next outlook. Strong revenue alone would not answer whether the company is converting growth into profit. No unreleased Q3 figure is treated here as a fact. [3,4]
The macro backdrop is not uniformly reassuring either. BEA’s October 29 release put September PCE inflation at 3.6% year over year, or 3.1% excluding food and energy. Real consumer spending rose less than 0.1% from August. These are broad economic conditions, not an AMD demand forecast or proof that inflation caused Friday’s decline. [9]
- PC check: separate industry weakness from AMD-specific execution. [2,3]
- AI check: compare data-center growth with profitability, not sales alone. [3]
- Macro check: keep inflation and consumer demand distinct from company guidance. [9]
What it means for option sellers
Yahoo’s snapshot retrieved Saturday at 16:22 ET listed 54.35% implied volatility for the November 2 US$505 call; its displayed last trade was October 30 at 3:59 p.m. Eastern. Prices were 15-minute delayed at the time of writing and came from the last completed session. This is one contract’s IV, not IV rank; a comparable current rank was not verified, so check live prices before trading. [5]
That November 2 contract expires before the announced November 3 results. It should not be used to describe volatility for an expiry that spans earnings. The Options Industry Council explains that IV often rises before a scheduled event and falls after uncertainty clears. A seller may benefit from that decline, yet an adverse stock-price gap can overwhelm the premium collected. [4,5,6]
Educational strike math—not a trade recommendation
Assume a standard 100-share contract. A hypothetical US$450 cash-secured put represents US$45,000 of strike cash before fees; expiration breakeven is US$450 minus premium per share. A hypothetical US$550 covered call can require selling 100 shares for US$55,000 if assigned. No quoted premium, available fill or profit is assumed. [7,8]
The wheel does not erase earnings risk
Put assignment can leave the seller owning shares after another fall. A covered call limits upside while retaining substantial stock downside. Friday’s low is an observation, not a guaranteed floor; the examples above are not screened setups. [1,7,8]
- Gap risk: an earnings surprise can overwhelm collected premium. [4,6]
- Assignment risk: a put can become stock ownership; a covered call still carries share-price downside. [7,8]
- Review plan: refresh the live chain and calendar before any new expiry. [4,5]
- Reassessment: compare the actual report with the stock obligation, not premium income alone. [3,7,8]
A competitor’s warning raises the question. AMD’s own results must supply the answer.
What to watch next
| Date | Checkpoint | Question |
|---|---|---|
| November 3, after close | AMD Q3 results; call 5 p.m. | Revenue, margin and next outlook |
| November 25, 8:30 a.m. | October Personal Income and Outlays | Inflation and real spending |
| December 1 | AMD at UBS technology/AI conference | Management commentary |
For a wheel review, the practical distinction is between an attractive-looking premium and an acceptable stock obligation. A fresh review needs the live chain, the event calendar and a realistic assignment scenario together. Tuesday can clarify the business debate, but neither the price drop nor a volatility reading guarantees a rebound or a profitable option sale. [4,6,7,8]
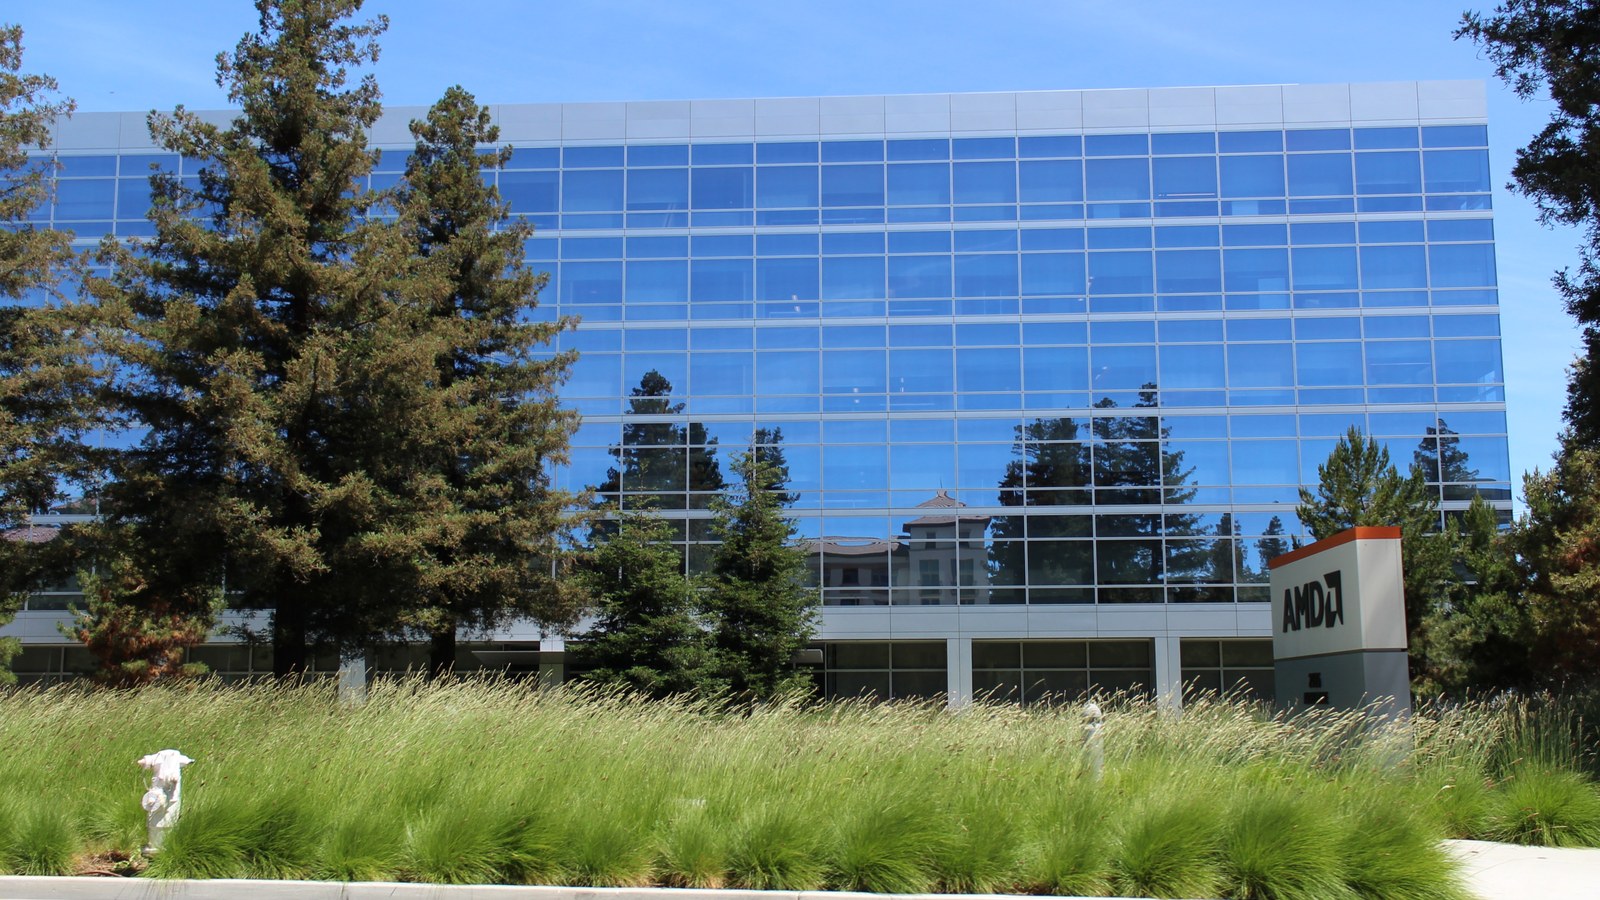
Hero: archival June 2020 photograph of AMD’s Santa Clara headquarters by Coolcaesar; cropped and resized. The adapted photograph remains under CC BY-SA 4.0, with source and license linked below. It does not depict current operations. [10,11]
Sources
- [1]AMD daily historical prices — Yahoo Finance · Accessed 2026-10-31T16:22:00.558969-04:00 · Tier 2
- [2]Intel Q3 2026 results and Q4 outlook — Intel · Accessed 2026-10-31T16:21:59.927737-04:00 · Tier 1
- [3]AMD Q2 2026 results and Q3 guidance — AMD · Accessed 2026-10-31T16:21:59.882166-04:00 · Tier 1
- [4]AMD November 3 earnings and investor-event calendar — AMD · Accessed 2026-10-31T16:21:59.662920-04:00 · Tier 1
- [5]AMD delayed option snapshot: November 2 expiration — Yahoo Finance · Accessed 2026-10-31T16:22:00.579426-04:00 · Tier 2
- [6]OIC articles: volatility, events and the wheel — Options Industry Council · Accessed 2026-10-31T16:21:59.943236-04:00 · Tier 1
- [7]Cash-secured put: obligations, payoff and risks — Options Industry Council · Accessed 2026-10-31T16:21:59.898551-04:00 · Tier 1
- [8]Covered call: assignment and risks — Options Industry Council · Accessed 2026-10-31T16:21:59.955925-04:00 · Tier 1
- [9]September 2026 Personal Income and Outlays — Bureau of Economic Analysis · Accessed 2026-10-31T16:22:00.129597-04:00 · Tier 1
- [10]Archival AMD headquarters photograph and file license — Wikimedia Commons · Accessed 2026-10-31T16:22:00.590802-04:00 · Tier 1
- [11]Creative Commons Attribution-ShareAlike 4.0 license — Creative Commons · Accessed 2026-10-31T16:22:00.049267-04:00 · Tier 1
- [12]Intel daily historical prices — Yahoo Finance · Accessed 2026-10-31T16:22:01.008298-04:00 · Tier 2
- [13]Nvidia daily historical prices — Yahoo Finance · Accessed 2026-10-31T16:22:01.029195-04:00 · Tier 2
- [14]Friday AMD sell-off and Intel PC-warning context — TIKR via Yahoo Finance · Accessed 2026-10-31T16:43:32.111900-04:00 · Tier 3
This content is for informational and educational purposes only and is not financial advice. Options involve risk and are not suitable for every investor. Do your own research before trading.
Keep YieldCove close
Choose YieldCove as a preferred source for Top Stories in Google Search.
Run the numbers before you trade: the free wheel strategy calculator sizes the whole cycle, and the cash-secured put calculator shows the cash, return and breakeven of one put.


