
Key takeaways
- Boeing’s October 28 cargo forecast sees 4,010 freighters worldwide by 2045, versus 2,395 in 2025. That is an industry projection, not Boeing orders.
- BA fell 10.69% on October 27 and remained lower in the dated October 28 snapshot.
- Commercial-aircraft losses and cash conversion matter more for near-term option risk than a distant demand forecast. [1–4]
Oct 28, 10:59 ET delayed snapshot
US$166.59
−0.95% versus prior close
Oct 27 regular-session change
−10.69%
US$168.18 close
Oct 27 daily-bar volume
47,078,000 shares
6.18× prior 20-session average
Q3 2026 revenue
US$24.188B
+4%, company-rounded
Q3 commercial operating loss
US$697M
−6.5% operating margin
Cboe 30-day implied volatility
30.25%
Same delayed snapshot; IV rank unverified
A long runway for cargo, a rough morning for BA
Boeing released its 2026 World Air Cargo Forecast on October 28 in Miami, projecting that global air-cargo traffic will double over the next 20 years. The announcement arrives one day after quarterly results exposed a familiar tension: customers need airplanes, but manufacturing them profitably and turning deliveries into cash remain harder. All dollar figures here are U.S. dollars. [1,2]
At 10:59 ET on October 28, Cboe’s delayed snapshot put BA at $166.585, rounded here to $166.59, down $1.595 or 0.95% from the $168.18 prior close. It recorded 7,671,243 shares of partial-session volume. Prices were 15-minute delayed at retrieval around 11:14 ET; this is a dated observation, not a live quote. Check live prices before trading. [4]
Tuesday’s full-session decline was much larger: $20.13, or 10.69%, from Monday’s $188.31 close. Yahoo’s October 27 historical daily bar records 47,078,000 shares, versus a calculated 7,611,975-share average over the preceding 20 sessions. That is 6.18 times the benchmark, separate from today’s incomplete volume and other vendors’ headline fields. [3]
What the new cargo forecast actually says
Boeing projects a worldwide freighter fleet of 4,010 aircraft in 2045, up from 2,395 in 2025, and demand for 2,930 new and converted freighters over that period. The larger delivery requirement includes replacing retiring airplanes as well as fleet growth; it is not simply the difference between the two fleet totals. [1]
The company identifies e-commerce, shifting supply chains and time-sensitive high-tech shipments as demand drivers. Crucially, it expects two-thirds of freighter deliveries to come from passenger-aircraft conversions, with the remainder newly built. The forecast describes a market shared across suppliers and conversion businesses, not guaranteed Boeing revenue or a promise that BA will recover. [1]
| Measure | Reported result | What it captures |
|---|---|---|
| Revenue | $24,188 | 4% year-over-year growth, rounded |
| GAAP diluted loss per share | −$0.26 | Not the non-GAAP core measure |
| Core loss per share, non-GAAP | −$0.34 | Adjusted company measure |
| Commercial operating loss | −$697 | Commercial margin: −6.5% |
| Operating cash flow, GAAP | $1,496 | Before capital expenditure |
| Free cash flow, non-GAAP | $464 | $1,496 less $1,032 capital expenditure |
Why investors are focused on execution
The earnings release attributes the commercial division’s weak margin to a less favorable delivery mix, higher projected costs for future production-rate changes and higher estimated supply-chain costs. Commercial revenue fell 3% to $10.720 billion despite 161 deliveries, versus 160 a year earlier. More units alone did not produce better sales mix. [2]
- The 737 program was still progressing toward stabilized production of 47 per month; the release does not say that target was achieved. The 787 rate remained stable at eight per month. [2]
- Defense revenue rose 15% to $7.935 billion, but its $492 million operating profit included a $252 million gain on the HRL Laboratories sale. That gain is not recurring aircraft-production profit. [2]
- Total backlog reached a record roughly $745 billion, including more than 6,300 commercial airplanes. Backlog is future work, not cash already collected or profit already earned. [2]
The investor presentation estimates approximately $2 billion of non-GAAP free cash flow in 2026 and $3 billion in 2027. Those remain management estimates, not achieved results. This gap between a substantial order book and a gradual cash recovery helps explain a cautious reading of the shares without pretending to know every seller’s motive. [13]
October 27: Boeing lagged aerospace peers
Completed-session price changes versus October 26; not total returns. The October 28 cargo announcement had not occurred. [3,5–7]
Source: Yahoo Finance unadjusted daily closes, October 26–27, 2026; retrieved October 28 at 11:14 ET. [3,5–7]
The peer tape was not uniformly strong: RTX fell 1.46% and Lockheed Martin lost 1.92% on October 27, while GE Aerospace gained 3.20%. Boeing’s much larger decline points to company-specific pressure alongside sector influences; it does not establish that one announcement caused every move. [3,5–7]
A bigger addressable market is not the same as cash arriving this quarter.
What it means for option sellers
Cboe’s same snapshot showed 30-day implied volatility of 30.25%. A verified IV rank was unavailable, so this article does not call premiums historically rich. After earnings, uncertainty can fall while the stock keeps dropping. Lower implied volatility can help a short option, but it cannot reliably offset losses from a large adverse stock move. [4,10]
Illustration, not a trade recommendation
For a hypothetical November 6 $155 cash-secured put covering 100 shares, assume a $1-per-share credit—not an observed quote. Cash reserved would be $15,500, maximum option profit $100 and expiry breakeven $154 before fees and taxes. At a $140 expiry price, the loss would be $1,400; at zero, $15,400. A strike below today’s snapshot is not a downside guarantee. [4,10]
A hypothetical November 6 $175 covered call illustrates the other wheel step: a shareholder collects a premium but can have shares called away at the strike, limiting upside. The premium offers only limited downside protection. Neither example is a rated setup, a current premium offer or a substitute for checking contract terms and liquidity. [4,11]
The main risk
Earnings have passed, not business risk. Production setbacks, cost revisions or a macro shock can move BA through a put strike before an investor can adjust. Assignment can leave the seller owning a falling stock; rolling does not erase that exposure. [2,10]
What to watch next
- October 28: the Federal Reserve’s calendar lists the FOMC meeting event at 2 p.m. ET. This article does not assume the decision or its market impact. [8]
- October 29, 8:30 a.m. ET: BEA schedules the advance Q3 GDP estimate and September Personal Income and Outlays, including the PCE inflation report. Those figures were not yet released at writing. [9]
- Beyond those dates: watch production stability, delivery mix and cash conversion against Boeing’s estimates. Its October 27 release keeps the first 777X delivery targeted for 2027, not a guaranteed date. [2,13]
The cargo forecast is useful long-term context. For the wheel, the nearer question is whether the underlying business is one a seller could withstand owning through further setbacks—not whether a low strike merely looks inexpensive after a sharp fall. This is general education, not personal financial advice.
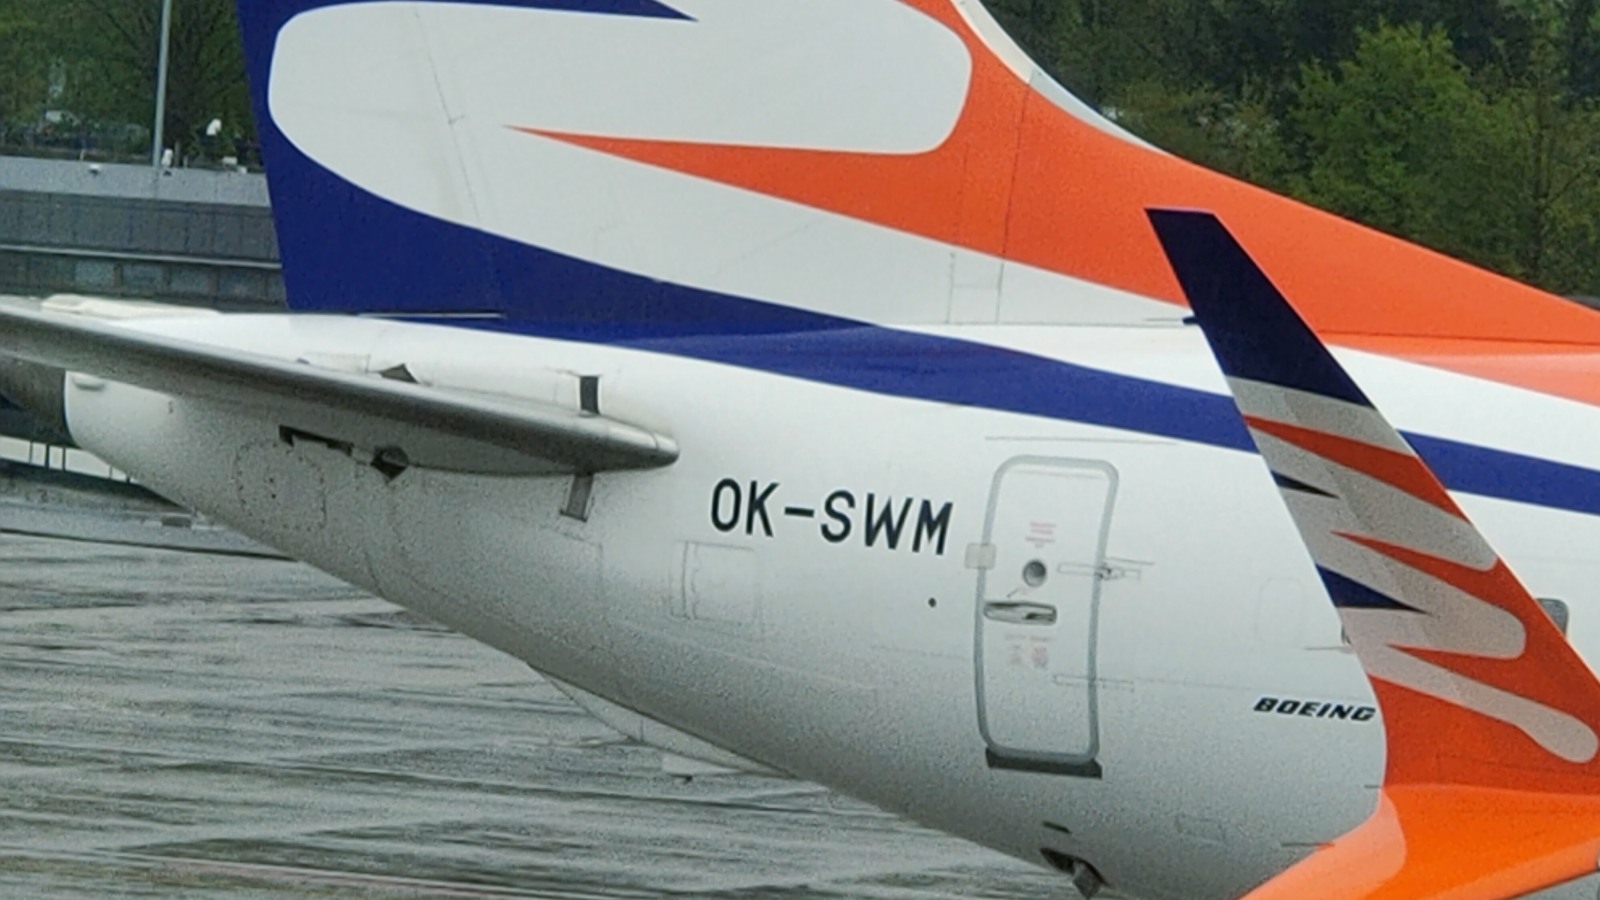
Photo: archival detail of a Smartwings Boeing 737 MAX 8 at Prague on April 24, 2025, not a freighter or today’s event. Wiki leylek; cropped and resized. The adapted image is licensed CC BY-SA 4.0. [12,14]
Sources
- [1]2026 World Air Cargo Forecast — October 28 release — Boeing · Accessed 2026-10-28T11:16:52.428657-04:00 · Tier 1
- [2]Third-quarter 2026 financial results — October 27 — Boeing · Accessed 2026-10-28T11:14:57.287152-04:00 · Tier 1
- [3]BA daily prices and volume — historical bars — Yahoo Finance · Accessed 2026-10-28T11:14:57.287564-04:00 · Tier 2
- [4]BA delayed underlying, IV and options snapshot — Cboe Global Markets · Accessed 2026-10-28T11:14:57.287840-04:00 · Tier 1
- [5]RTX historical daily prices — Yahoo Finance · Accessed 2026-10-28T11:14:57.287772-04:00 · Tier 2
- [6]LMT historical daily prices — Yahoo Finance · Accessed 2026-10-28T11:14:57.288591-04:00 · Tier 2
- [7]GE Aerospace historical daily prices — Yahoo Finance · Accessed 2026-10-28T11:14:57.288471-04:00 · Tier 2
- [8]October 2026 calendar — FOMC meeting event — Federal Reserve · Accessed 2026-10-28T11:16:52.429063-04:00 · Tier 1
- [9]2026 economic release schedule — Bureau of Economic Analysis · Accessed 2026-10-28T11:14:57.662597-04:00 · Tier 1
- [10]Cash-secured put mechanics and risks — Options Industry Council / OCC · Accessed 2026-10-28T11:21:14.587556-04:00 · Tier 1
- [11]Covered call mechanics and risks — Options Industry Council / OCC · Accessed 2026-10-28T11:21:14.587860-04:00 · Tier 1
- [12]Smartwings OK-SWM archival photograph — author, date and license — Wikimedia Commons / Wiki leylek · Accessed 2026-10-28T11:16:52.428510-04:00 · Tier 4
- [13]Third-quarter 2026 investor presentation — cash-flow estimates — Boeing · Accessed 2026-10-28T11:16:52.428931-04:00 · Tier 1
- [14]Creative Commons Attribution-ShareAlike 4.0 International — Creative Commons · Accessed 2026-10-28T11:16:52.427873-04:00 · Tier 1
This content is for informational and educational purposes only and is not financial advice. Options involve risk and are not suitable for every investor. Do your own research before trading.
Keep YieldCove close
Choose YieldCove as a preferred source for Top Stories in Google Search.
Run the numbers before you trade: the free wheel strategy calculator sizes the whole cycle, and the cash-secured put calculator shows the cash, return and breakeven of one put.


